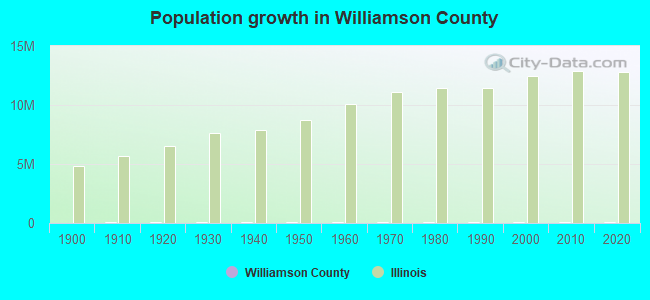
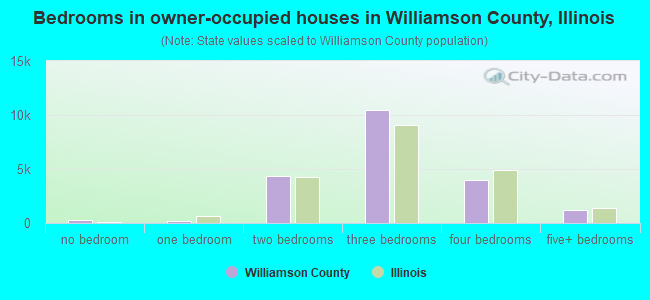
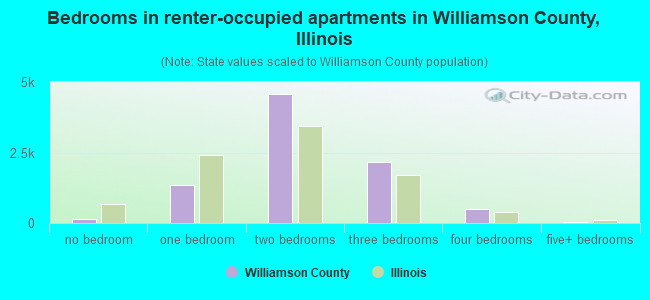
County population in 2024: 67,064 (59% urban, 41% rural); it was 61,296 in 2000County owner-occupied with a mortgage or a loan houses and condos in 2020: 10,805 County owner-occupied free and clear houses and condos in 2020: 8,633 County owner-occupied houses and condos in 2000: 18,672, in 2010: 8,316 Renter-occupied apartments: 8,707 (it was 6,686 in 2000, and 7,818 in 2010)
% of renters here:
26%
State:
31%
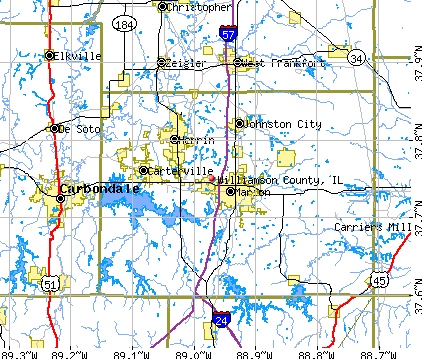
Land area: 423 sq. mi.
Water area: 21.0 sq. mi.
Population density: 158 people per square mile (average).
December 2024 cost of living index in Williamson County: 75.1 (low, U.S. average is 100)
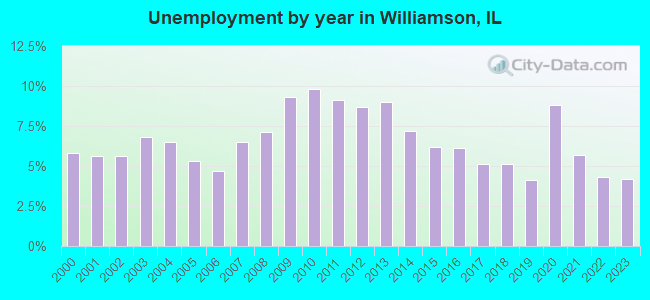
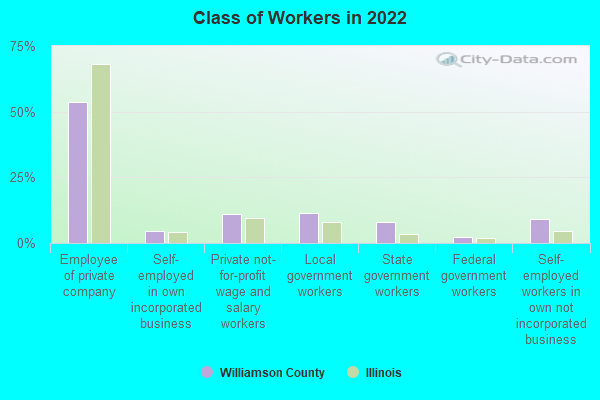
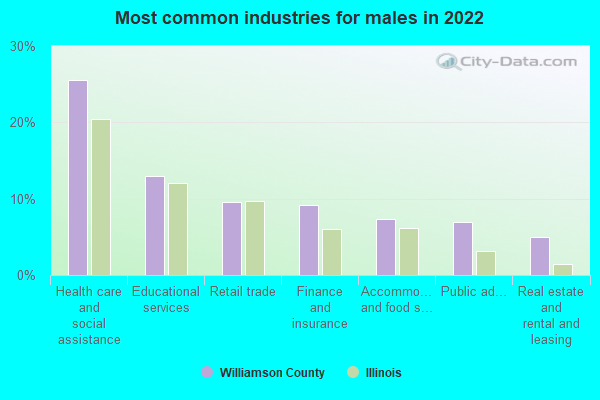
Industries providing employment: Educational, health and social services (28.1%), Retail trade (12.3%).
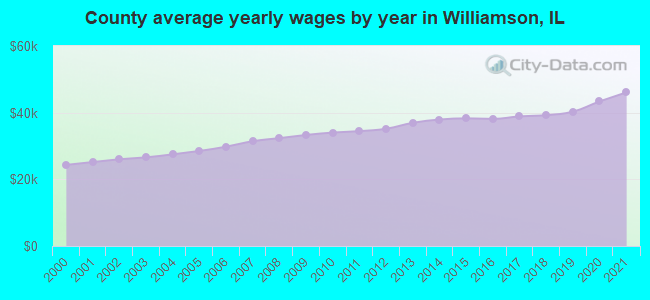
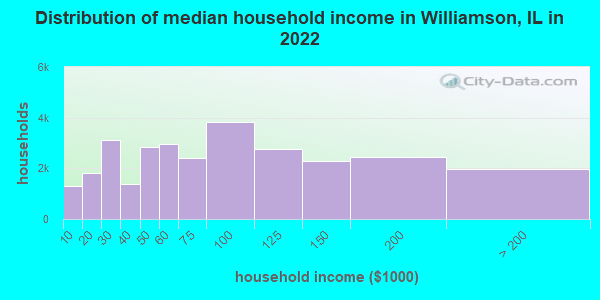
Estimated median household income in 2024: $68,415 ($31,991 in 1999)
This county:
$68,415
Illinois:
$83,211
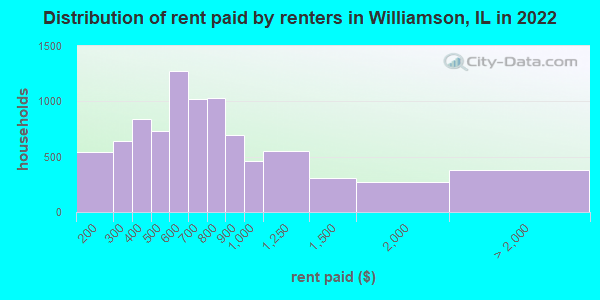
Median contract rent in 2024 for apartments: $680 (lower quartile is $560, upper quartile is $848)
This county:
$680
State:
$1159
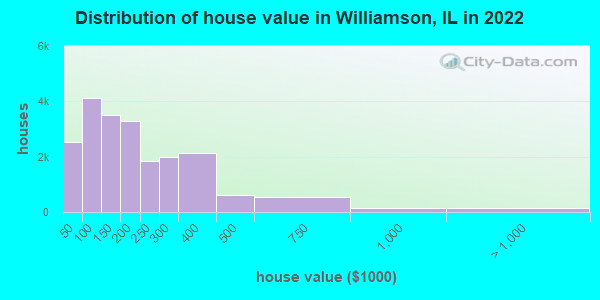
Estimated median house or condo value in 2024: $167,700 (it was $61,200 in 2000)
Williamson:
$167,700
Illinois:
$280,700
Lower value quartile - upper value quartile: $98,700 - $269,800 Median monthly housing costs for homes and condos with a mortgage: $1,440 Median monthly housing costs for units without a mortgage: $577
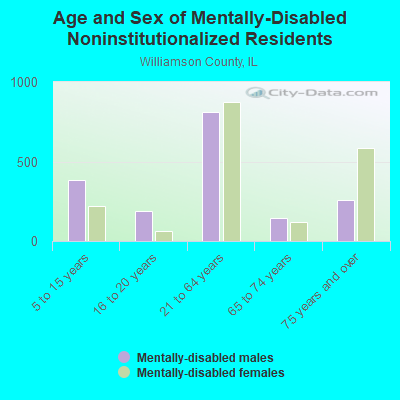
Institutionalized population: 1,822
Crime in 2019 (reported by the sheriff's office or county police, not the county total):
Murders: 2
Rapes: 4
Robberies: 1
Assaults: 1
Burglaries: 45
Thefts: 183
Auto thefts: 20
Crime in 2018 (reported by the sheriff's office or county police, not the county total):
Murders: 0
Rapes: 11
Robberies: 1
Assaults: 0
Burglaries: 67
Thefts: 189
Auto thefts: 24
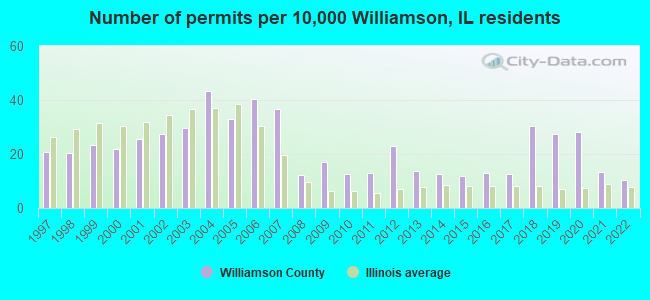
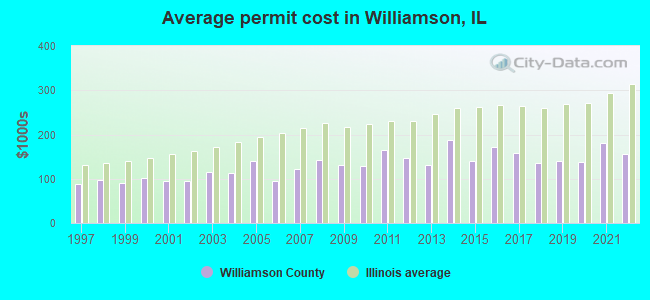
Single-family new house construction building permits:
Median real estate property taxes paid for housing units with mortgages in 2024: $3,412 (1.9%) Median real estate property taxes paid for housing units with no mortgage in 2024: $2,321 (1.5%)
Percentage of residents living in poverty in 2024: 11.4%
Williamson County:
11.4%
Illinois:
11.6%
(10.3% for White Non-Hispanic residents, 30.3% for Black residents, 23.3% for Hispanic or Latino residents, 16.0% for American Indian residents, 7.2% for other race residents, 28.1% for two or more races residents)
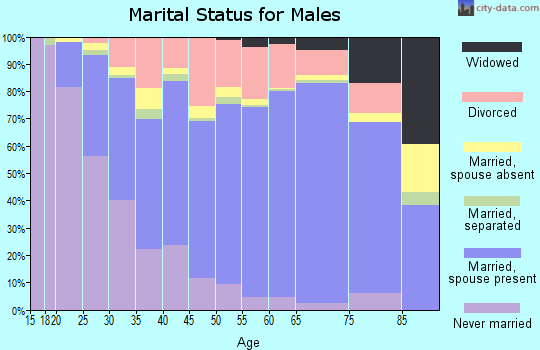
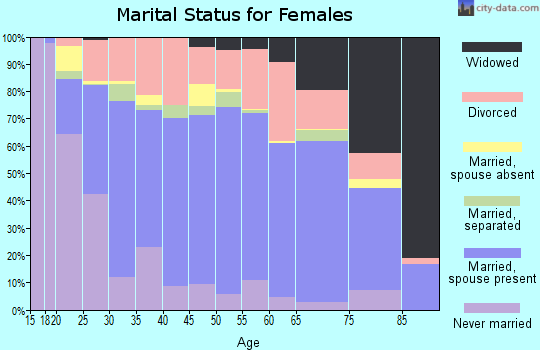
Median age of residents in 2024: 42.1 years old
(Males: 41.3 years old, Females: 43.0 years old)
(Median age for: White residents: 44.1 years old, Black residents: 30.7 years old, American Indian residents: 42.3 years old, Asian residents: 59.0 years old, Hispanic or Latino residents: 23.3 years old, Other race residents: 31.6 years old)
Fair market rent in 2006 for a 1-bedroom apartment in Williamson County is $375 a month. Fair market rent for a 2-bedroom apartment is $492 a month. Fair market rent for a 3-bedroom apartment is $709 a month.
Notable locations in this county outside city limits:
Notable locations in Williamson County: Pine Ridge Camp (A), Little Grassy Fish Hatchery (B), Pulleys Mill (C), Cedar Point Camp (D), Camp Carew (E), Halfway (F), Air Evac Lifeteam (G), Crab Orchard National Wildlife Refuge Fire Response (H), Lake Egypt Fire Protection District Station 4 (I), Lake Egypt Fire Protection District Station 5 (J), Williamson County Fire Protection District Station 4 (K). Display/hide their locations on the map
Churches in Williamson County include: Allens Chapel (A), Arnold View Church (B), Palestine Church (C), Bethel Church (D), Cedar Grove United Methodist Church (E), Pulleys Mill Pentecostal Church (F), Plumville Church (G), Ralls Grove Church (H), Cana Church (I). Display/hide their locations on the map
Cemeteries: Barter Cemetery (1), New Spring Grove Cemetery (2), Walker Cemetery (3), Arnold Cemetery (4), Ward Cemetery (5), Atwood Cemetery (6), Blair Cemetery (7). Display/hide their locations on the map
Lakes and reservoirs: Caplinger Pond (A), Pond 60 (B), Pond 38 (C), Pond 33 (D), Pond 17 (E), Johnston City Sewage Lagoon (F), Belford Lake (G), Lake Number 5 (H). Display/hide their locations on the map
Streams, rivers, and creeks: White Oak Creek (A), Caney Branch (B), Buckley Creek (C), Bear Creek (D), Lost Branch (E), Rock Creek (F), Little Saline Creek (G), Little Crab Orchard Creek (H), Limb Branch (I). Display/hide their locations on the map
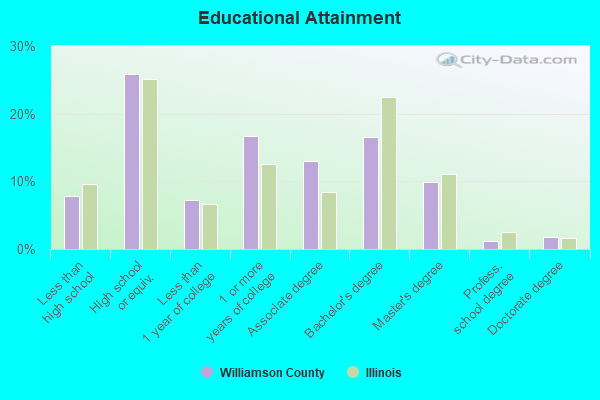
Current college students: 3,462 People 25 years of age or older with a high school degree or higher: 94.3% People 25 years of age or older with a bachelor's degree or higher: 24.5%
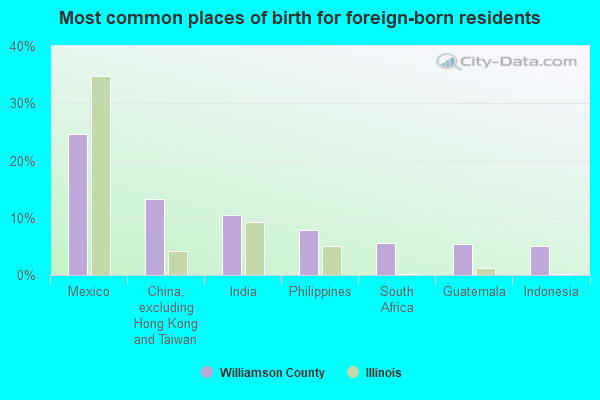
Number of foreign born residents: 1,446 (87.1% naturalized citizens)
Williamson County:
2.2%
Whole state:
15.4%
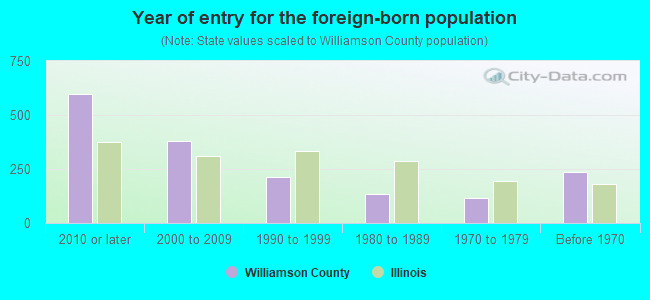
Year of entry for the foreign-born population
4532010 or later
2802000 to 2009
1921990 to 1999
1331980 to 1989
1151970 to 1979
238Before 1970
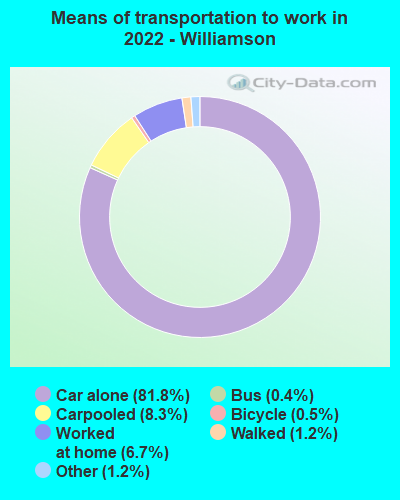
Mean travel time to work (commute): 23 minutes
Percentage of county residents living and working in this county: 99.3%
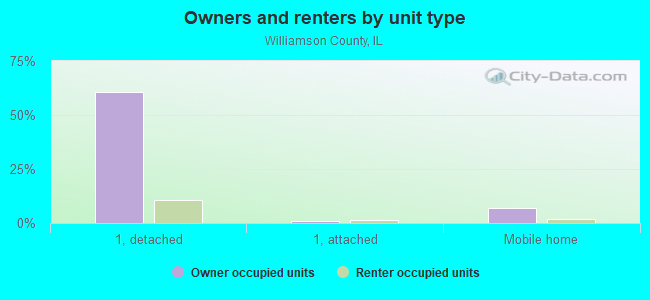
Housing units in structures:
One, detached: 25,482
One, attached: 388
Two: 1,530
3 or 4: 965
5 to 9: 1,072
10 to 19: 167
20 to 49: 233
50 or more: 243
Mobile homes: 2,198
Housing units in Williamson County with a mortgage: 11,611 (869 second mortgage, 20 home equity loan, 700 both second mortgage and home equity loan) Houses without a mortgage: 121
Here:
8.3% with mortgage
State:
97.6% with mortgage
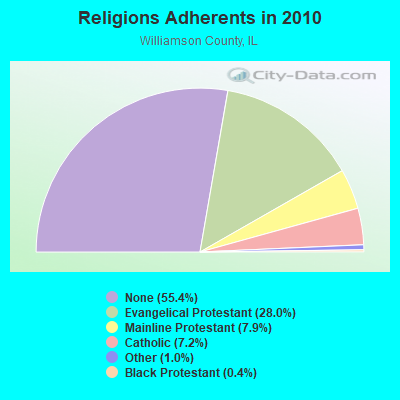
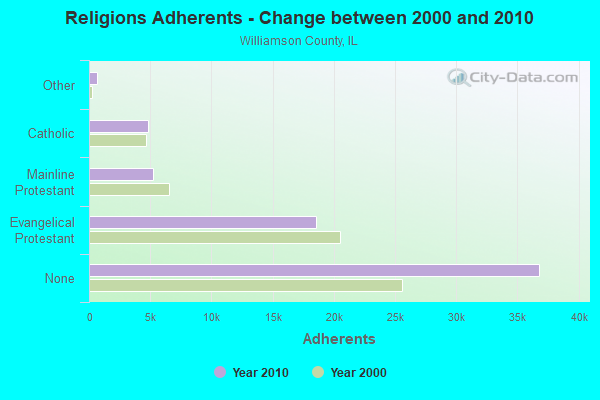
Religion statistics for Williamson County
Religion
Adherents
Congregations
Evangelical Protestant
18,581
89
Mainline Protestant
5,268
29
Catholic
4,788
5
Other
684
4
Black Protestant
242
2
None
36,794
-
Williamson County Religion Details
Source: Clifford Grammich, Kirk Hadaway, Richard Houseal, Dale E.Jones, Alexei Krindatch, Richie Stanley and Richard H.Taylor. 2012. 2010 U.S.Religion Census: Religious Congregations & Membership Study. Association of Statisticians of American Religious Bodies. Jones, Dale E., et al. 2002. Congregations and Membership in the United States 2000. Nashville, TN: Glenmary Research Center.
Food Environment Statistics:
Number of grocery stores: 14
Williamson County:
2.18 / 10,000 pop.
State:
2.24 / 10,000 pop.
Number of supercenters and club stores: 1
Here:
0.16 / 10,000 pop.
Illinois:
0.08 / 10,000 pop.
Number of convenience stores (no gas): 1
This county:
0.16 / 10,000 pop.
Illinois:
0.75 / 10,000 pop.
Number of convenience stores (with gas): 29
Williamson County:
4.52 / 10,000 pop.
Illinois:
2.61 / 10,000 pop.
Number of full-service restaurants: 47
This county:
7.32 / 10,000 pop.
State:
6.86 / 10,000 pop.
Adult diabetes rate:
Williamson County:
8.8%
Illinois:
8.3%
Adult obesity rate:
Williamson County:
28.0%
State:
25.2%
Low-income preschool obesity rate:
Here:
11.9%
State:
14.5%
Agriculture in Williamson County:
Average size of farms: 167 acres Average value of agricultural products sold per farm: $15,491 Average value of crops sold per acre for harvested cropland: $117.75 The value of livestock, poultry, and their products as a percentage of the total market value of agricultural products sold: 40.09% Average total farm production expenses per farm: $32,241 Harvested cropland as a percentage of land in farms: 47.22% Irrigated harvested cropland as a percentage of land in farms: 0.01% Average market value of all machinery and equipment per farm: $34,809 The percentage of farms operated by a family or individual: 93.19% Average age of principal farm operators: 57 years Average number of cattle and calves per 100 acres of all land in farms: 9.28 Milk cows as a percentage of all cattle and calves: 0.14% Corn for grain: 13872 harvested acres All wheat for grain: 169 harvested acres Soybeans for beans: 23899 harvested acres Vegetables: 25 harvested acres Land in orchards: 68 acres
Tornado activity:
Williamson County historical area-adjusted tornado activity is significantly below Illinois state average. It is 1959422.3 times below overall U.S. average. Tornadoes in this county have caused 10 fatalities and 197 injuries recorded between 1950 and 2024.
On 1982-05-29, a category F4 (max. wind speeds 207-260 mph) tornado killed 10 people and injured 181 people and caused between $50,000,000 and $500,000,000 in damages. On 1991-11-19, a category F3 (max. wind speeds 158-206 mph) tornado injured 16 people and caused between $5,000,000 and $50,000,000 in damages.
Earthquake activity:
Williamson County-area historical earthquake activity is above Illinois state average. It is 50% smaller than the overall U.S. average.
On 4/18/2008 at 09:36:59, a magnitude 5.4 (5.1 MB, 4.8 MS, 5.4 MW, 5.2 MW, Class: Moderate, Intensity: VI - VII) earthquake occurred 76.5 miles away from Williamson County center On 4/18/2008 at 09:36:59, a magnitude 5.2 (5.2 MW, Depth: 8.9 mi) earthquake occurred 76.5 miles away from the county center On 9/26/1990 at 13:18:51, a magnitude 5.0 (4.7 MB, 4.8 LG, 5.0 LG, Depth: 7.7 mi) earthquake occurred 50.8 miles away from the county center On 6/18/2002 at 17:37:15, a magnitude 5.0 (4.3 MB, 4.6 MW, 5.0 LG) earthquake occurred 67.1 miles away from the county center On 6/10/1987 at 23:48:54, a magnitude 5.1 (4.9 MB, 4.4 MS, 4.6 MS, 5.1 LG) earthquake occurred 94.8 miles away from Williamson County center On 5/4/1991 at 01:18:54, a magnitude 5.0 (4.4 MB, 4.6 LG, 5.0 LG, Depth: 3.1 mi) earthquake occurred 94.4 miles away from the county center Magnitude types: regional Lg-wave magnitude (LG), body-wave magnitude (MB), surface-wave magnitude (MS), moment magnitude (MW)
Most recent natural disasters:
Illinois Covid-19, Incident Period: Jan 20, 2020 - May 11, 2023, FEMA Id: 3435, Natural disaster type: Other
Illinois Covid-19 Pandemic, Incident Period: January 20, 2020, FEMA Id: 4489, Natural disaster type: Other
Illinois Severe Storms and Flooding, Incident Period: April 19, 2011 to June 14, 2011, Major Disaster (Presidential) Declared DR-1991: June 07, 2011, FEMA Id: 1991, Natural disaster type: Storm, Flood
Illinois Severe Storms, Flooding, and Tornadoes, Incident Period: May 08, 2009 to May 09, 2009, Major Disaster (Presidential) Declared DR-1850: July 02, 2009, FEMA Id: 1850, Natural disaster type: Storm, Tornado, Flood
Illinois Hurricane Katrina Evacuation, Incident Period: August 29, 2005 to October 01, 2005, Emergency Declared EM-3230: September 07, 2005, FEMA Id: 3230, Natural disaster type: Hurricane
Illinois Snow, Incident Period: December 21, 2004 to December 23, 2004, Emergency Declared EM-3199: February 01, 2005, FEMA Id: 3199, Natural disaster type: Snow
Illinois Severe Storms, Tornadoes, and Flooding, Incident Period: April 21, 2002 to May 23, 2002, Major Disaster (Presidential) Declared DR-1416: May 21, 2002, FEMA Id: 1416, Natural disaster type: Storm, Tornado, Flood
Illinois Severe Storms/Flooding, Incident Period: April 28, 1996 to May 17, 1996, Major Disaster (Presidential) Declared DR-1112: May 06, 1996, FEMA Id: 1112, Natural disaster type: Storm, Flood
Illinois Severe Storms, Tornadoes, Incident Period: June 05, 1982, Major Disaster (Presidential) Declared DR-660: June 05, 1982, FEMA Id: 660, Natural disaster type: Storm, Tornado
The number of natural disasters in Williamson County (9) is smaller than the US average (19). Major Disasters (Presidential) Declared: 5 Emergencies Declared: 2
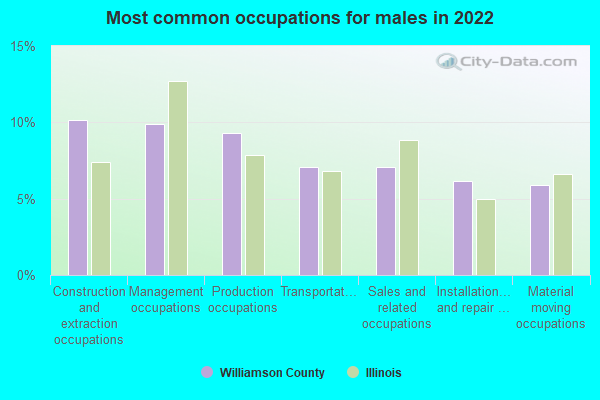
Installation, maintenance, and repair occupations (8%)
Business and financial operations occupations (6%)
Office and administrative support occupations (18%)
Sales and related occupations (12%)
Management occupations (9%)
Food preparation and serving related occupations (9%)
Educational instruction, and library occupations (9%)
Production occupations (8%)
Health diagnosing and treating practitioners and other technical occupations (6%)
China, excluding Hong Kong and Taiwan (14%)
India (10%)
Guatemala (9%)
Mexico (9%)
Philippines (7%)
Cuba (5%)
Germany (5%)
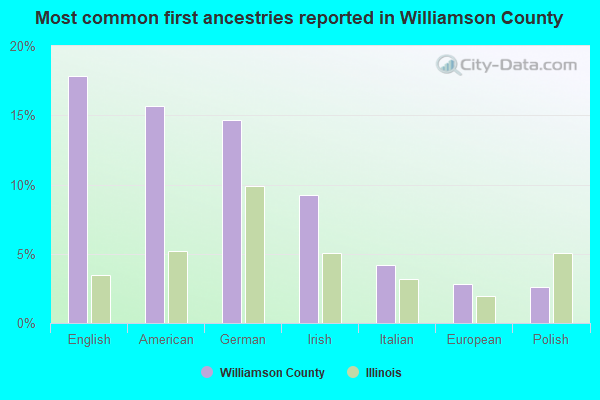
English (16%)
American (15%)
German (15%)
Irish (10%)
Italian (5%)
Polish (2%)
European (2%)
People in group quarters in Williamson County, Illinois in 2020:
1,438 people in correctional facilities for adults
36 people in federal detention centers
1,351 people in federal prisons
51 people in local jails and other municipal confinement facilitie
384 people in nursing facilities/skilled-nursing facilities
207 people in other noninstitutional facilities
26 people in emergency and transitional shelters (with sleeping facilities) for people experiencing homelessness
124 people in group homes intended for adults
19 people in residential treatment centers for adults
38 people in other noninstitutional facilities
People in group quarters in Williamson County, Illinois in 2010:
1,006 people in federal prisons
498 people in nursing facilities/skilled-nursing facilities
207 people in local jails and other municipal confinement facilities
69 people in other noninstitutional facilities
50 people in group homes intended for adults
40 people in emergency and transitional shelters (with sleeping facilities) for people experiencing homelessness
People in group quarters in Williamson County, Illinois in 2000:
732 people in nursing homes
608 people in federal prisons and detention centers
74 people in local jails and other confinement facilities (including police lockups)
71 people in orthopedic wards and institutions for the physically handicapped
37 people in other noninstitutional group quarters
36 people in homes for the mentally retarded
35 people in wards in general hospitals for patients who have no usual home elsewhere
24 people in other group homes
20 people in halfway houses
10 people in other types of correctional institutions
3 people in religious group quarters
3 people in other nonhousehold living situations
Average gross adjusted income of non-migrant taxpayers in this county in 2021 was $71,014.
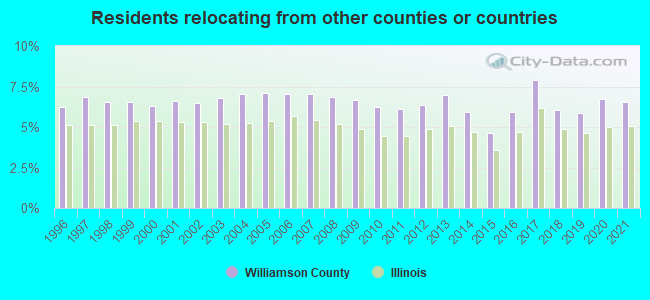
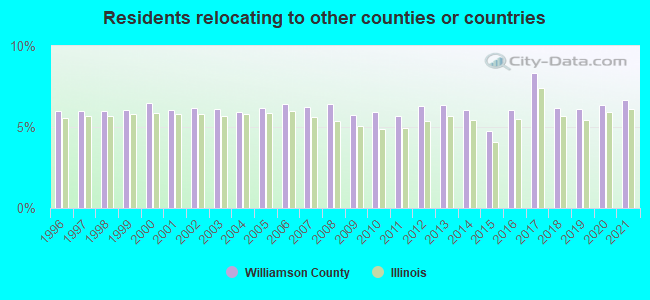
6.72% of this county's 2022 resident taxpayers lived in other counties in 2021 ($51,024 average adjusted gross income)
Here:
6.72%
Illinois average:
5.03%
10 or fewer of this county's residents moved from foreign countries.
4.44% relocated from other counties in Illinois ($33,307 average AGI)
2.27% relocated from other states ($17,717 average AGI)
Williamson County:
2.27%
Illinois average:
2.13%
Top counties from which taxpayers relocated into this county between 2021 and 2022:
6.38% of this county's 2021 resident taxpayers moved to other counties in 2022 ($56,829 average adjusted gross income)
Here:
6.38%
Illinois average:
5.87%
10 or fewer of this county's residents moved to foreign countries.
3.94% relocated to other counties in Illinois ($29,417 average AGI)
2.44% relocated to other states ($27,412 average AGI)
Williamson County:
2.44%
Illinois average:
2.99%
Top counties to which taxpayers relocated from this county between 2021 and 2022:
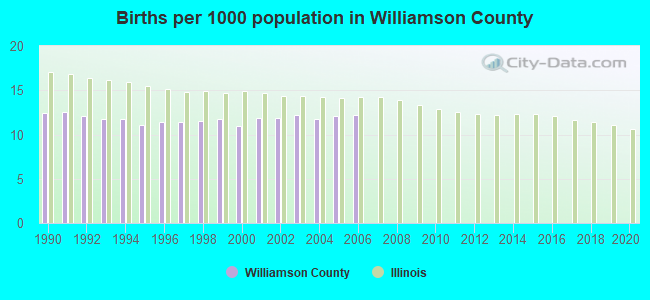
Births per 1000 population from 1990 to 1999: 11.8 Births per 1000 population from 2000 to 2006: 11.9
Deaths per 1000 population from 1990 to 1999: 11.5 Deaths per 1000 population from 2000 to 2009: 11.8 Deaths per 1000 population from 2010 to 2020: 11.4
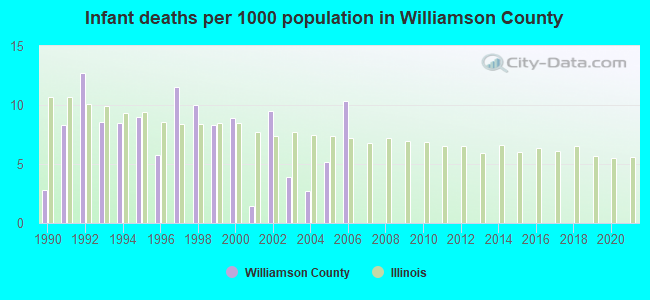
Infant deaths per 1000 live births from 1990 to 1999: 8.6 Infant deaths per 1000 live births from 2000 to 2006: 6.0
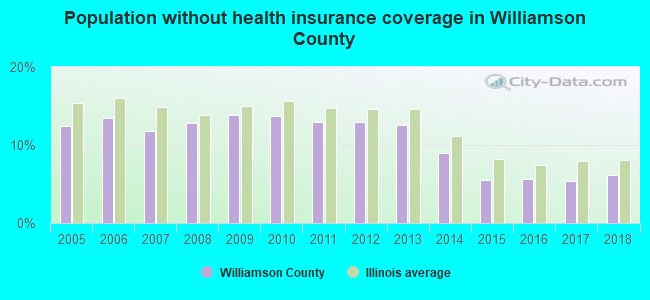
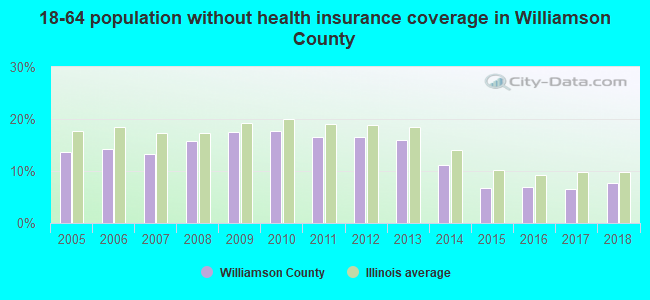
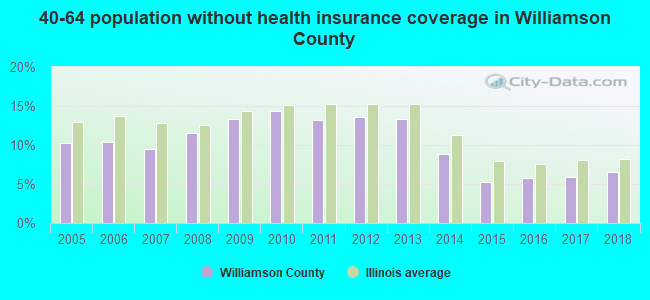
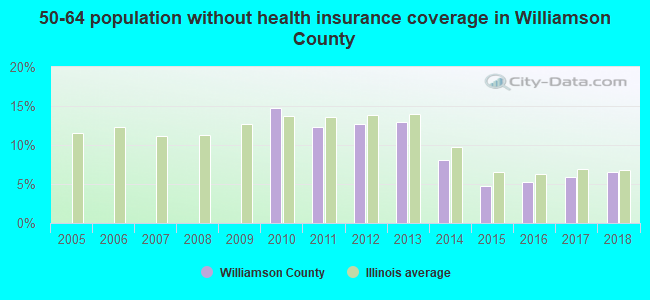
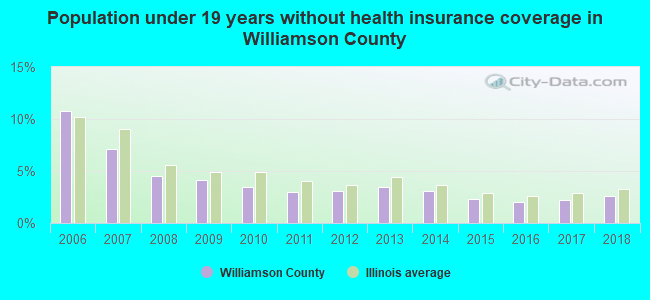
Population without health insurance coverage in 2023: 5.6% Persons under 19 years old without health insurance coverage in 2023: 3.1%
Percentage of population without health insurance coverage in Williamson County
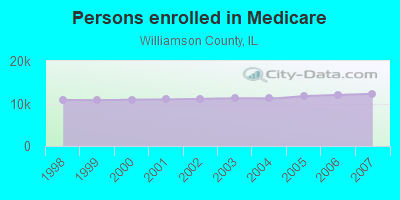
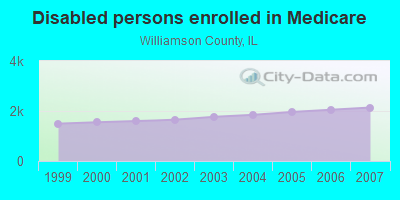
Persons enrolled in hospital insurance and/or supplemental medical insurance (Medicare) in July 1, 2007: 12,268 (10,129 aged, 2,139 disabled) Children under 18 without health insurance coverage in 2007: 1,082 (7%)
Most common underlying causes of death in Williamson County, Illinois in 1999 - 2019:
Acute myocardial infarction, unspecified (1,276)
Bronchus or lung, unspecified - Malignant neoplasms (1,094)
Stroke, not specified as haemorrhage or infarction (441)
Alzheimer disease, unspecified (427)
Pneumonia, unspecified (354)
Septicaemia, unspecified (353)
Population without health insurance coverage in 2000: 13% Children under 18 without health insurance coverage in 2000: 10%
Short term general hospitals per 100,000 population in 2004: 4.75 Short term general hospital admissions per 100,000 population in 2004: 19,666 Short term general hospital beds per 100,000 population in 2004: 469 Emergency room visits per 100,000 population in 2004: 91,296
General practice office based MDs per 100,000 population in 2005: 1,160 Medical specialist MDs per 100,000 population in 2005: 1,236 Dentists per 100,000 population in 1998: 13
Total births per 100,000 population, July 2005 - July 2006 : 31 Total deaths per 100,000 population, July 2005 - July 2006: 74
Limited-service eating places per 100,000 population in 2005 : 8
Suicides per 1,000,000 population from 2000 to 2006: 116.6. This is more than state average.
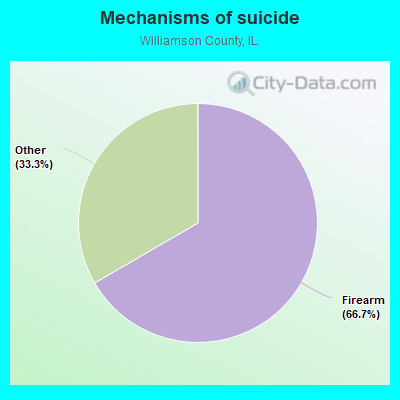
Deaths per 1,000,000 population:
Firearm - 77.7
Other - 38.9
Household type by relationship:
Households: 67,064
Male householders: 14,325 (3,591 living alone), Female householders: 14,785 (3,961 living alone)
8,320 married couples with children.
4,605 single-parent households (993 men, 3,612 women).
96.2% of residents of Williamson speak English at home.
1.4% of residents speak Spanish at home (77% speak English very well, 7% speak English well, 14% speak English not well, 2% don't speak English at all).
0.8% of residents speak other Indo-European language at home (89% speak English very well, 11% speak English well).
1.1% of residents speak Asian or Pacific Island language at home (68% speak English very well, 17% speak English well, 14% speak English not well).
0.1% of residents speak other language at home (100% speak English very well).
In fiscal year 2004:
Federal Government expenditure: $534,942,000 ($8,478 per capita) Department of Defense expenditure: $135,267,000 Federal direct payments to individuals for retirement and disability: $174,818,000 Federal other direct payments to individuals: $84,240,000 Federal direct payments not to individuals: $5,772,000 Federal grants: $68,025,000 Federal procurement contracts: $127,882,000 ($122,024,000 Department of Defense) Federal salaries and wages: $74,206,000 ($5,709,000 Department of Defense) Federal Government direct loans: $4,557,000 Federal guaranteed/insured loans: $19,205,000 Federal Government insurance: $21,569,000
Population change from April 1, 2000 to July 1, 2005:
Births: 3,849
Here:
61 per 1000 residents
State:
75 per 1000 residents
Deaths: 3,900
Here:
61 per 1000 residents
State:
43 per 1000 residents
Net international migration: +83
Here:
+1 per 1000 residents
State:
+26 per 1000 residents
Net internal migration: +2,360
Here:
+37 per 1000 residents
State:
-31 per 1000 residents
Total withdrawal of fresh water for public supply: 2.46 millions of gallons per day (2% from ground, 98% from surface)
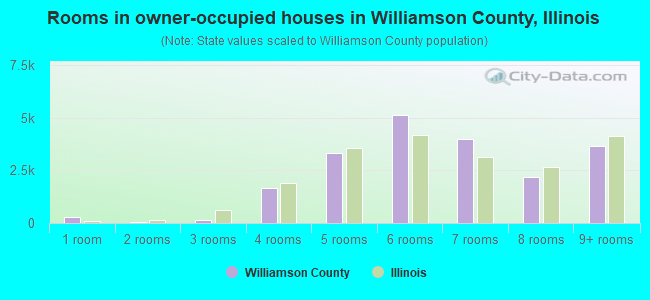
Median number of rooms in houses and condos:
Here:
6.4
State:
6.4
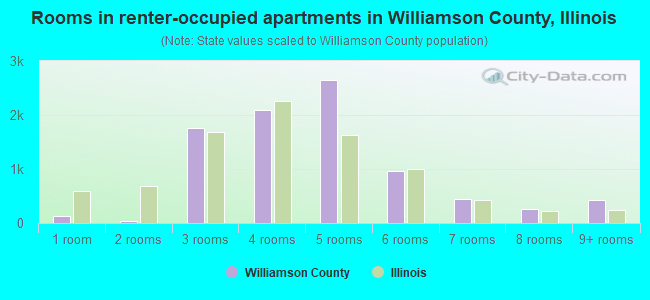
Median number of rooms in apartments:
Here:
5.0
State:
4.0
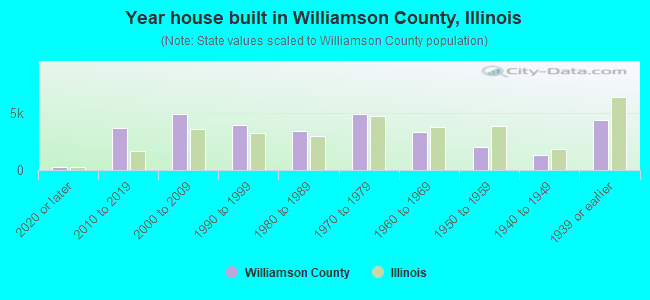
Year house built in Williamson County, Illinois
8442020 or later
2,3592010 to 2019
4,2362000 to 2009
4,7691990 to 1999
3,2931980 to 1989
4,8321970 to 1979
3,3811960 to 1969
2,3491950 to 1959
1,3131940 to 1949
4,9021939 or earlier
Rooms in houses/apartments in Williamson County, Illinois
Cars and other vehicles available in Williamson County in owner-occupied houses/condos
801no vehicle
4,6261 vehicle
10,2292 vehicles
3,4623 vehicles
1,8974 vehicles
4025+ vehicles
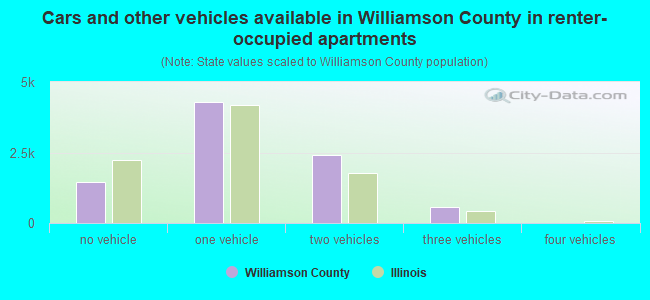
Cars and other vehicles available in Williamson County in renter-occupied apartments
730no vehicle
3,6571 vehicle
2,6622 vehicles
5553 vehicles
444 vehicles
455+ vehicles
88.5% of Williamson County residents lived in the same house 1 years ago. Out of people who lived in different houses, 34% lived in this county. Out of people who lived in different counties, 64% lived in Illinois.
Williamson County:
88.5%
State average:
89.8%
Place of birth for U.S.-born residents:
This state: 48,501
Other state: 16,904
Northeast: 1,551
Midwest: 7,255
South: 5,578
West: 2,520
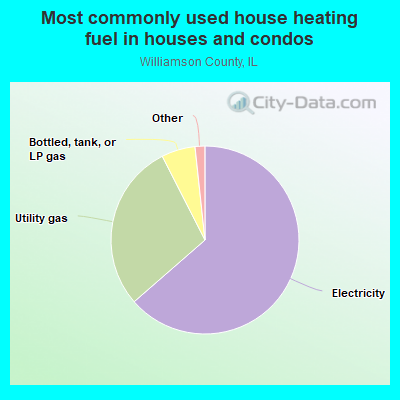
Most commonly used house heating fuel in Williamson County


 , Jackson County
  , Johnson County
  , Pope County
  , Saline County
  , Union County
  .
.