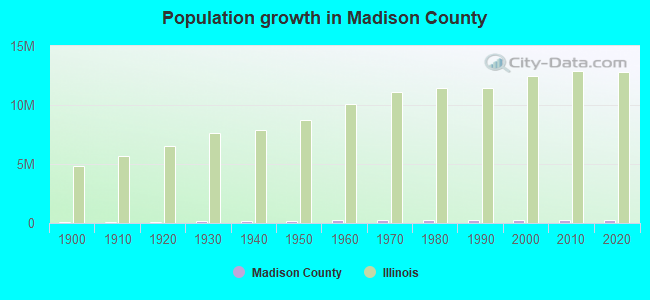
County population in 2024: 263,017 (84% urban, 16% rural); it was 258,941 in 2000County owner-occupied with a mortgage or a loan houses and condos in 2020: 51,055 County owner-occupied free and clear houses and condos in 2020: 26,366 County owner-occupied houses and condos in 2000: 75,235, in 2010: 24,375 Renter-occupied apartments: 31,186 (it was 26,718 in 2000, and 29,635 in 2010)
% of renters here:
26%
State:
29%
Land area: 725 sq. mi.
Water area: 15.3 sq. mi.
Population density: 363 people per square mile (high).
December 2024 cost of living index in Madison County: 94.7 (less than average, U.S. average is 100)
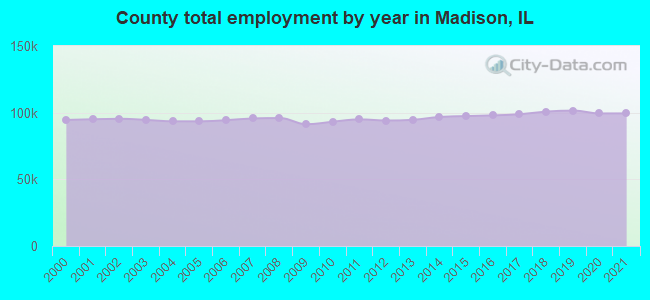
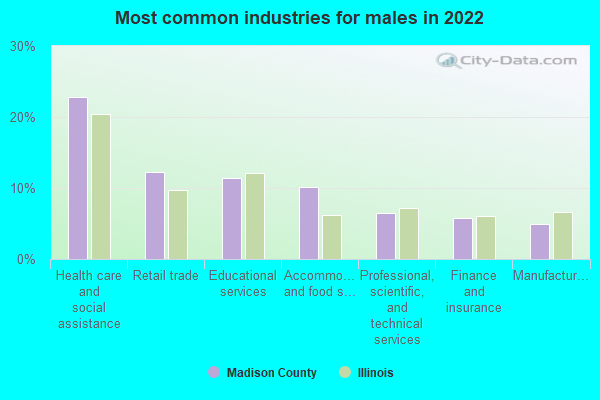
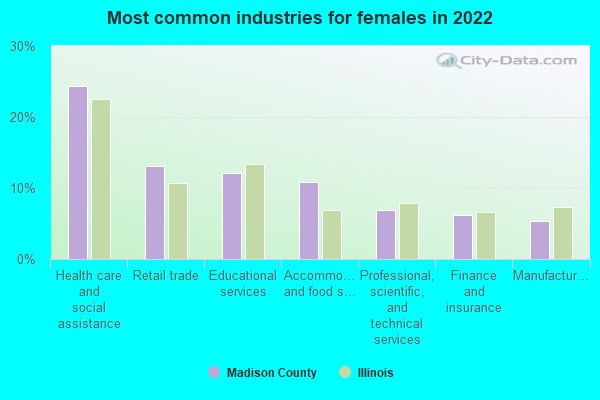
Industries providing employment: Educational, health and social services (24.1%), Professional, scientific, management, administrative, and waste management services (11.5%), Retail trade (11.4%), Manufacturing (11.3%).
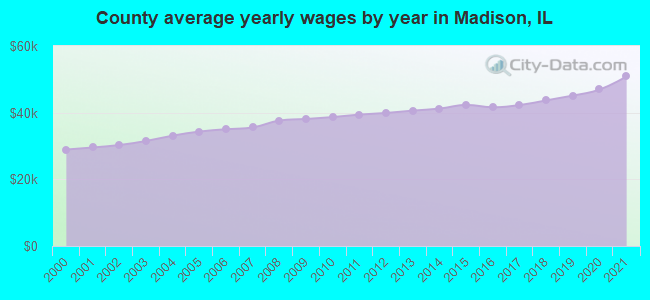
Estimated median household income in 2024: $78,751 ($41,541 in 1999)
This county:
$78,751
Illinois:
$83,211
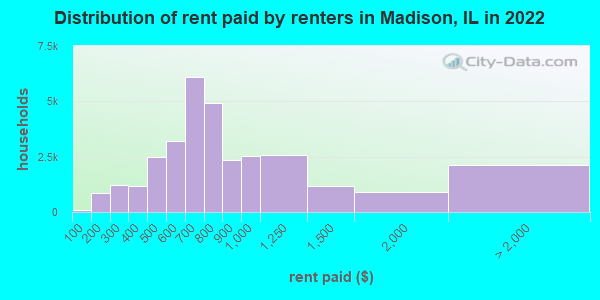
Median contract rent in 2024 for apartments: $834 (lower quartile is $630, upper quartile is $1,099)
This county:
$834
State:
$1159
Estimated median house or condo value in 2024: $195,500 (it was $76,500 in 2000)
Madison:
$195,500
Illinois:
$280,700
Lower value quartile - upper value quartile: $112,300 - $317,500
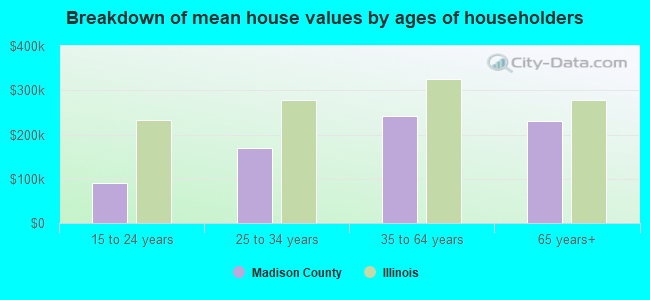
Mean price in 2024:
Detached houses: $230,534
Here:
$230,534
State:
$348,937
Townhouses or other attached units: $203,317
Here:
$203,317
State:
$315,719
In 2-unit structures: $173,197
Here:
$173,197
State:
$383,967
In 3-to-4-unit structures: $95,453
Here:
$95,453
State:
$347,966
In 5-or-more-unit structures: $173,793
Here:
$173,793
State:
$376,404
Mobile homes: $66,297
Here:
$66,297
State:
$93,581
Median monthly housing costs for homes and condos with a mortgage: $1,580 Median monthly housing costs for units without a mortgage: $711
Institutionalized population: 2,197
Crime in 2024 (reported by the sheriff's office or county police, not the county total):
Murders: 0
Rapes: 29
Robberies: 5
Assaults: 63
Burglaries: 219
Thefts: 390
Auto thefts: 60
Crime in 2023 (reported by the sheriff's office or county police, not the county total):
Murders: 1
Rapes: 22
Robberies: 5
Assaults: 54
Burglaries: 202
Thefts: 439
Auto thefts: 69
Health of residents in Madison County based on CDC Behavioral Risk Factor Surveillance System Survey Questionnaires from 2013 to 2021:
General health status score of residents in this county from 1 (poor) to 5 (excellent) is 3.4. This is about average. 71.9% of residents exercised in the past month. This is about average. 45.2% of residents smoked 100+ cigarettes in their lives. This is about average. 53.7% of adult residents drank alcohol in the past 30 days. This is less than average. 67.3% of residents visited a dentist within the past year. This is about average. Average weight of males is 200 pounds. This is more than average. Average weight of females is 167 pounds. This is more than average.
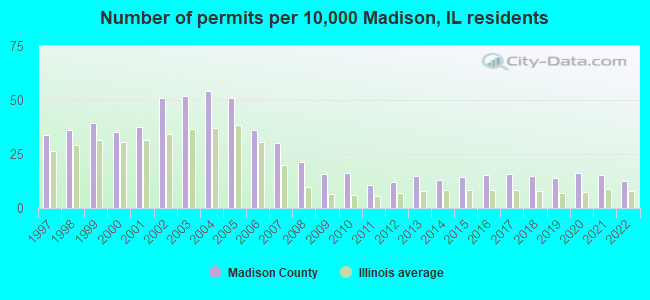
Single-family new house construction building permits:
Median real estate property taxes paid for housing units with mortgages in 2024: $3,661 (1.8%) Median real estate property taxes paid for housing units with no mortgage in 2024: $3,076 (1.7%)
Percentage of residents living in poverty in 2024: 9.2%
Madison County:
9.2%
Illinois:
11.6%
(7.0% for White Non-Hispanic residents, 26.5% for Black residents, 19.0% for Hispanic or Latino residents, 16.7% for American Indian residents, 23.4% for other race residents, 14.6% for two or more races residents)
Median age of residents in 2024: 40.8 years old
(Males: 39.1 years old, Females: 41.7 years old)
(Median age for: White residents: 43.4 years old, Black residents: 33.5 years old, American Indian residents: 48.3 years old, Asian residents: 36.3 years old, Hispanic or Latino residents: 26.5 years old, Other race residents: 25.7 years old)
Area name: St. Louis, MO-IL HUD Metro FMR Area Fair market rent in 2006 for a 1-bedroom apartment in Madison County is $526 a month. Fair market rent for a 2-bedroom apartment is $654 a month. Fair market rent for a 3-bedroom apartment is $842 a month.
Notable locations in this county outside city limits:
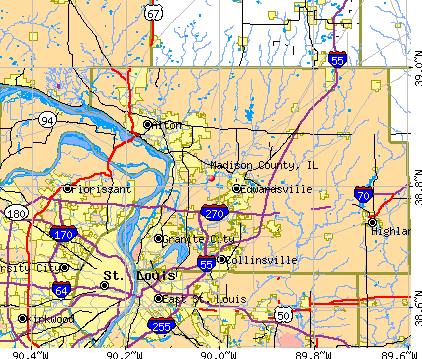
Notable locations in Madison County: Grainey Siding (A), De Camp (B), Alhambra Sewage Treatment Plant (C), Edwardsville Sewage Treatment Plant (D), Granite City Wastewater Treatment Plant (E), Mills Apple Farm (F), Cool Breeze Farm (G), Triangle H Farm (H), Demange Farm (I), Cloverleaf Golf Course (J), Opel's Fish Hatchery (K), Oak Brook Golf Course (L), Saint Catherines Golf Club (M), Camp Torque (N), Quercus Grove (O), Down A Lane Farms (P), Steinkoeing Dairy (Q), Opels Fish Farm (R), Vadalabene Center (S), University Center (T). Display/hide their locations on the map
Churches in Madison County include: Bethany Church (A), Salem Church (B), Emmaus Church (C), Immanuel Church (D), Saint Peter Lutheran Church (E), Saint John United Church of Christ (F), Apostolic Revival Church (G), Zion Lutheran Church (H), Saint John the Baptist Catholic Church (I). Display/hide their locations on the map
Cemeteries: Anderson Family Cemetery (1), Augusta Cemetery (2), Watt Cemetery (3), Widicus Family Cemetery (4), Wittman Cemetery (5), Calvary Cemetery (6), Liberty Prairie Cemetery (7). Display/hide their locations on the map
Lakes and reservoirs: Heavenly Hills Lake (A), Chouteau Slough (B), Vesper Lake (C), Big Four Reservoir (D), Magin Lake (E), Staunton Coal Company Reservoir (F), Sportsman Lake (G), Lake Meadow (H). Display/hide their locations on the map
Streams, rivers, and creeks: Sherry Creek (A), Dentons Branch (B), Cahokia Diversion Channel (C), Burroughs Branch (D), Buckeye Branch (E), East Fork Silver Creek (F), Black Creek (G), Spanker Branch (H), Mill Creek (I). Display/hide their locations on the map
Parks in Madison County include: Belk Park (1), Roy E Lee Field (2), Simmons Cooper Baseball Complex (3), Stratton Quadrangle (4), Lewis and Clark State Memorial Park (5), Sam Vadalabene Field (6), Quercus Grove Park (7). Display/hide their locations on the map
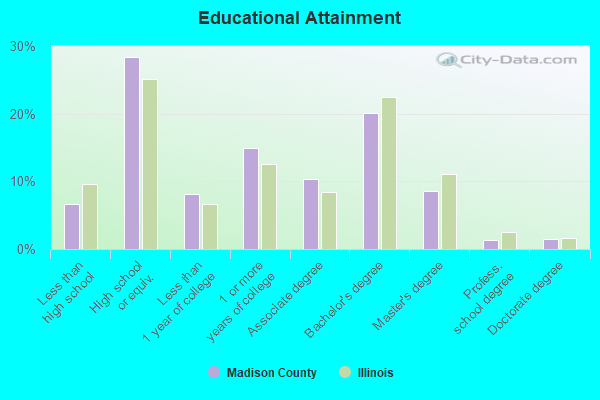
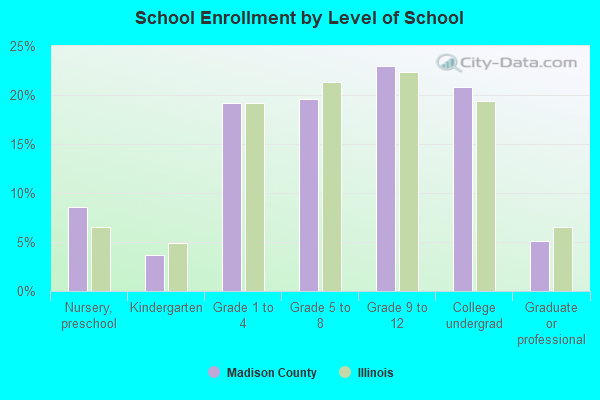
Current college students: 17,380 People 25 years of age or older with a high school degree or higher: 93.7% People 25 years of age or older with a bachelor's degree or higher: 32.0%
Number of foreign born residents: 6,307 (57.1% naturalized citizens)
Madison County:
2.4%
Whole state:
15.4%
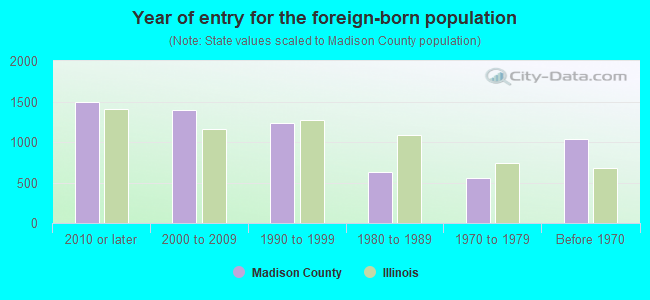
Year of entry for the foreign-born population
2,0622010 or later
1,3232000 to 2009
1,3111990 to 1999
6341980 to 1989
5511970 to 1979
1,036Before 1970
Mean travel time to work (commute): 24 minutes
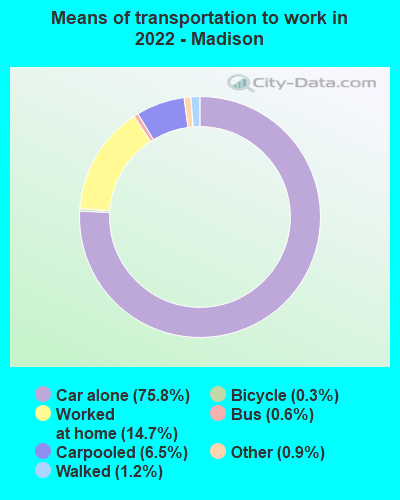
Percentage of county residents living and working in this county: 75.8%
Housing units in structures:
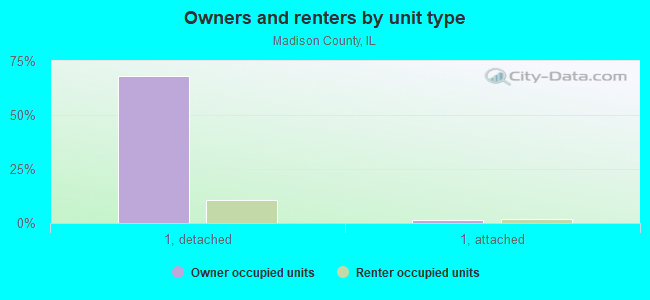
One, detached: 93,096
One, attached: 3,900
Two: 4,486
3 or 4: 5,110
5 to 9: 2,042
10 to 19: 2,245
20 to 49: 2,030
50 or more: 3,265
Mobile homes: 3,415
Housing units in Madison County with a mortgage: 49,647 (4,679 second mortgage, 133 home equity loan, 4,024 both second mortgage and home equity loan) Houses without a mortgage: 1,458
Here:
98.0% with mortgage
State:
97.6% with mortgage
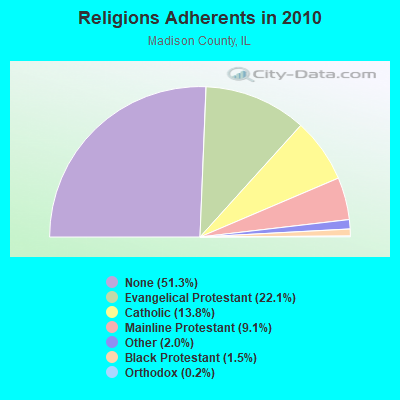
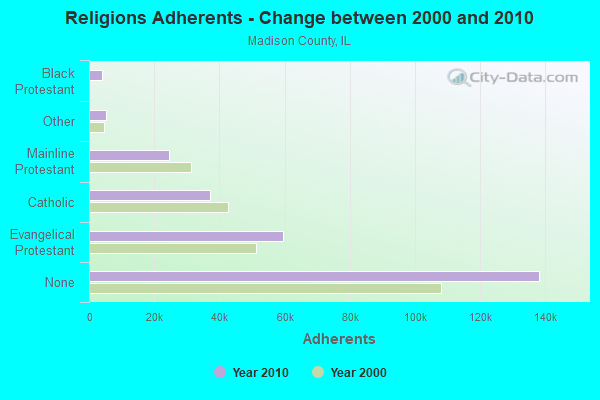
Religion statistics for Madison County
Religion
Adherents
Congregations
Evangelical Protestant
59,455
212
Catholic
37,243
21
Mainline Protestant
24,545
79
Other
5,330
20
Black Protestant
3,942
21
Orthodox
590
4
None
138,177
-
Madison County Religion Details
Source: Clifford Grammich, Kirk Hadaway, Richard Houseal, Dale E.Jones, Alexei Krindatch, Richie Stanley and Richard H.Taylor. 2012. 2010 U.S.Religion Census: Religious Congregations & Membership Study. Association of Statisticians of American Religious Bodies. Jones, Dale E., et al. 2002. Congregations and Membership in the United States 2000. Nashville, TN: Glenmary Research Center.
Food Environment Statistics:
Number of grocery stores: 48
Madison County:
1.80 / 10,000 pop.
State:
2.24 / 10,000 pop.
Number of supercenters and club stores: 1
Here:
0.04 / 10,000 pop.
Illinois:
0.08 / 10,000 pop.
Number of convenience stores (no gas): 18
This county:
0.67 / 10,000 pop.
Illinois:
0.75 / 10,000 pop.
Number of convenience stores (with gas): 100
Madison County:
3.74 / 10,000 pop.
Illinois:
2.61 / 10,000 pop.
Number of full-service restaurants: 190
This county:
7.11 / 10,000 pop.
State:
6.86 / 10,000 pop.
Adult diabetes rate:
Madison County:
9.2%
Illinois:
8.3%
Adult obesity rate:
Madison County:
27.8%
State:
25.2%
Low-income preschool obesity rate:
Here:
9.6%
State:
14.5%
Agriculture in Madison County:
Average size of farms: 257 acres Average value of agricultural products sold per farm: $67,878 Average value of crops sold per acre for harvested cropland: $261.89 The value of nursery, greenhouse, floriculture, and sod as a percentage of the total market value of agricultural products sold: 8.66% The value of livestock, poultry, and their products as a percentage of the total market value of agricultural products sold: 16.64% Average total farm production expenses per farm: $63,350 Harvested cropland as a percentage of land in farms: 84.18% Irrigated harvested cropland as a percentage of land in farms: 0.56% Average market value of all machinery and equipment per farm: $86,597 The percentage of farms operated by a family or individual: 88.45% Average age of principal farm operators: 56 years Average number of cattle and calves per 100 acres of all land in farms: 5.35 Milk cows as a percentage of all cattle and calves: 11.22% Corn for grain: 96038 harvested acres All wheat for grain: 22073 harvested acres Soybeans for beans: 123085 harvested acres Vegetables: 2,016 harvested acres Land in orchards: 123 acres
Tornado activity:
Madison County historical area-adjusted tornado activity is significantly below Illinois state average. It is 1479219.1 times below overall U.S. average. Tornadoes in this county have caused 9 fatalities and 92 injuries recorded between 1950 and 2024.
On 1950-12-02, a category F3 (max. wind speeds 158-206 mph) tornado killed 2 people and injured 25 people and caused between $500,000 and $5,000,000 in damages. On 1981-04-03, a category F4 (max. wind speeds 207-260 mph) tornado injured 32 people and caused between $5,000,000 and $50,000,000 in damages. On 2021-12-10, a category F3 (max. wind speeds 158-206 mph) tornado killed 6 people and injured one person and caused $5000000 million in damages. On 1960-06-30, a category F2 (max. wind speeds 113-157 mph) tornado injured 17 people and caused between $500,000 and $5,000,000 in damages. On 1950-12-02, a category F2 (max. wind speeds 113-157 mph) tornado killed one person and injured 3 people and caused between $5000 and $50,000 in damages. On 1998-06-14, a category F1 (max. wind speeds 73-112 mph) tornado injured 4 people. On 1983-05-01, a category F3 (max. wind speeds 158-206 mph) tornado injured 3 people and caused between $5,000,000 and $50,000,000 in damages. On 1960-02-09, a category F1 (max. wind speeds 73-112 mph) tornado injured 2 people and caused between $50,000 and $500,000 in damages. On 2001-04-10, a category F1 (max. wind speeds 73-112 mph) tornado injured one person and caused $5 million in damages. On 1957-12-18, a category F2 (max. wind speeds 113-157 mph) tornado injured one person and caused between $5000 and $50,000 in damages. On 1958-05-03, a category F2 (max. wind speeds 113-157 mph) tornado injured one person and caused between $5000 and $50,000 in damages. On 1999-04-08, a category F1 (max. wind speeds 73-112 mph) tornado injured one person. On 2011-02-27, a category F2 (max. wind speeds 113-157 mph) tornado injured one person.
Earthquake activity:
Madison County-area historical earthquake activity is above Illinois state average. It is 52% smaller than the overall U.S. average.
On 4/18/2008 at 09:36:59, a magnitude 5.4 (5.1 MB, 4.8 MS, 5.4 MW, 5.2 MW, Class: Moderate, Intensity: VI - VII) earthquake occurred 117.9 miles away from Madison County center On 4/18/2008 at 09:36:59, a magnitude 5.2 (5.2 MW, Depth: 8.9 mi) earthquake occurred 117.9 miles away from the county center On 6/10/1987 at 23:48:54, a magnitude 5.1 (4.9 MB, 4.4 MS, 4.6 MS, 5.1 LG) earthquake occurred 115.0 miles away from the county center On 9/26/1990 at 13:18:51, a magnitude 5.0 (4.7 MB, 4.8 LG, 5.0 LG, Depth: 7.7 mi) earthquake occurred 116.8 miles away from the county center On 6/18/2002 at 17:37:15, a magnitude 5.0 (4.3 MB, 4.6 MW, 5.0 LG) earthquake occurred 134.1 miles away from Madison County center On 5/4/1991 at 01:18:54, a magnitude 5.0 (4.4 MB, 4.6 LG, 5.0 LG, Depth: 3.1 mi) earthquake occurred 155.9 miles away from the county center Magnitude types: regional Lg-wave magnitude (LG), body-wave magnitude (MB), surface-wave magnitude (MS), moment magnitude (MW)
Most recent natural disasters:
Illinois Severe Storms, Straight-line Winds, and Tornadoes, Incident Period: Dec 10, 2021, FEMA Id: 3577, Natural disaster type: Storm, Tornado, Wind
Illinois Covid-19, Incident Period: Jan 20, 2020 - May 11, 2023, FEMA Id: 3435, Natural disaster type: Other
Illinois Covid-19 Pandemic, Incident Period: January 20, 2020, FEMA Id: 4489, Natural disaster type: Other
Illinois Severe Storms And Flooding, Incident Period: February 24, 2019 - July 3, 2019, FEMA Id: 4461, Natural disaster type: Storm, Flood
Illinois Severe Storms and Flooding, Incident Period: June 01, 2008 to July 22, 2008, Major Disaster (Presidential) Declared DR-1771: June 24, 2008, FEMA Id: 1771, Natural disaster type: Storm, Flood
Illinois Severe Winter Storm, Incident Period: November 30, 2006 to December 01, 2006, Major Disaster (Presidential) Declared DR-1681: February 09, 2007, FEMA Id: 1681, Natural disaster type: Winter Storm
Illinois Hurricane Katrina Evacuation, Incident Period: August 29, 2005 to October 01, 2005, Emergency Declared EM-3230: September 07, 2005, FEMA Id: 3230, Natural disaster type: Hurricane
Illinois Severe Storms, Tornadoes, and Flooding, Incident Period: April 21, 2002 to May 23, 2002, Major Disaster (Presidential) Declared DR-1416: May 21, 2002, FEMA Id: 1416, Natural disaster type: Storm, Tornado, Flood
Illinois Severe Storms/Flooding, Incident Period: April 28, 1996 to May 17, 1996, Major Disaster (Presidential) Declared DR-1112: May 06, 1996, FEMA Id: 1112, Natural disaster type: Storm, Flood
Illinois Severe Storm, Flooding, Incident Period: May 15, 1995 to June 15, 1995, Major Disaster (Presidential) Declared DR-1053: May 30, 1995, FEMA Id: 1053, Natural disaster type: Storm, Flood
6 other natural disasters have been reported since 1953.
The number of natural disasters in Madison County (16) is near the US average (19). Major Disasters (Presidential) Declared: 11 Emergencies Declared: 1
Causes of natural disasters: Floods: 11, Storms: 11, Tornadoes: 4, Heavy Rain: 1, Hurricane: 1, Wind: 1, Winter Storm: 1, Other: 2 (Note: some incidents may be assigned to more than one category).
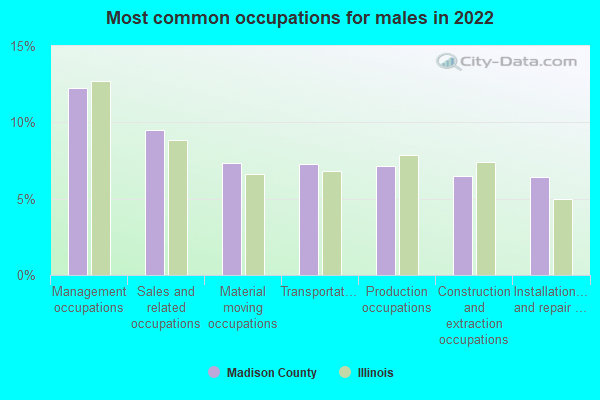
Installation, maintenance, and repair occupations (7%)
Material moving occupations (7%)
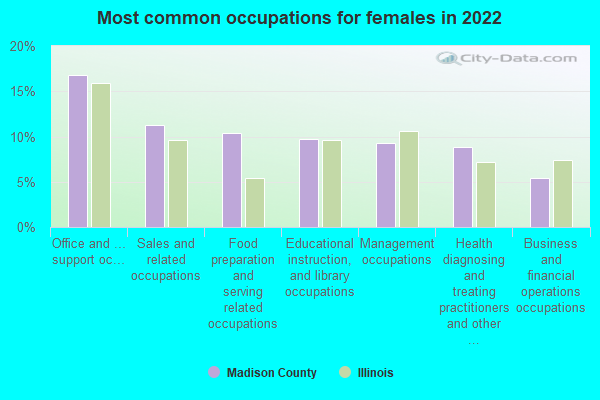
Business and financial operations occupations (6%)
Office and administrative support occupations (16%)
Management occupations (11%)
Educational instruction, and library occupations (10%)
Sales and related occupations (9%)
Health diagnosing and treating practitioners and other technical occupations (9%)
Business and financial operations occupations (8%)
Food preparation and serving related occupations (7%)
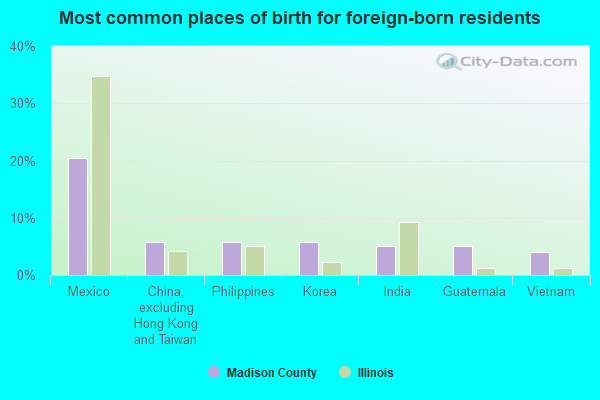
Mexico (20%)
Philippines (8%)
Korea (7%)
India (7%)
China, excluding Hong Kong and Taiwan (4%)
Canada (4%)
Vietnam (4%)
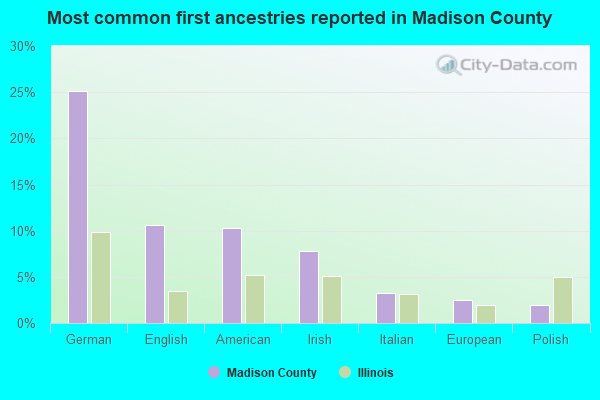
German (24%)
American (11%)
English (11%)
Irish (8%)
Italian (4%)
European (2%)
Polish (2%)
People in group quarters in Madison County, Illinois in 2020:
3,464 people in college/university student housing
1,834 people in nursing facilities/skilled-nursing facilities
1,023 people in other noninstitutional facilities
5 people in emergency and transitional shelters (with sleeping facilities) for people experiencing homelessness
566 people in group homes intended for adults
378 people in residential treatment centers for adults
74 people in other noninstitutional facilities
203 people in correctional facilities for adults
9 people in federal detention centers
181 people in local jails and other municipal confinement facilitie
13 people in correctional residential facilities
110 people in other institutional facilities
110 people in mental(psychiatric) hospitals and psychiatric units in other hospitals
50 people in juvenile facilities
7 people in group homes for juveniles (non-correctional)
26 people in residential treatment centers for juveniles (non-correctional)
17 people in correctional facilities intended for juveniles
People in group quarters in Madison County, Illinois in 2010:
1,573 people in nursing facilities/skilled-nursing facilities
1,165 people in college/university student housing
342 people in residential treatment centers for adults
321 people in group homes intended for adults
118 people in mental (psychiatric) hospitals and psychiatric units in other hospitals
104 people in other noninstitutional facilities
41 people in emergency and transitional shelters (with sleeping facilities) for people experiencing homelessness
36 people in workers' group living quarters and job corps centers
22 people in residential treatment centers for juveniles (non-correctional)
18 people in correctional facilities intended for juveniles
14 people in federal detention centers
People in group quarters in Madison County, Illinois in 2000:
2,234 people in nursing homes
2,197 people in college dormitories (includes college quarters off campus)
267 people in local jails and other confinement facilities (including police lockups)
267 people in other nonhousehold living situations
169 people in homes for the mentally retarded
166 people in mental (psychiatric) hospitals or wards
121 people in religious group quarters
116 people in homes for the mentally ill
83 people in other noninstitutional group quarters
62 people in short-term care, detention or diagnostic centers for delinquent children
49 people in homes or halfway houses for drug/alcohol abuse
19 people in homes for abused, dependent, and neglected children
15 people in homes for the physically handicapped
8 people in other group homes
4 people in unknown juvenile institutions
2 people in wards in general hospitals for patients who have no usual home elsewhere
Average gross adjusted income of non-migrant taxpayers in this county in 2021 was $82,708.
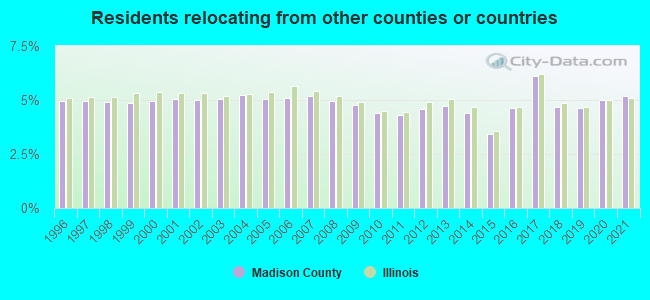
5.03% of this county's 2022 resident taxpayers lived in other counties in 2021 ($53,270 average adjusted gross income)
Here:
5.03%
Illinois average:
5.03%
10 or fewer of this county's residents moved from foreign countries.
2.45% relocated from other counties in Illinois ($23,862 average AGI)
2.59% relocated from other states ($29,408 average AGI)
Madison County:
2.59%
Illinois average:
2.13%
Top counties from which taxpayers relocated into this county between 2021 and 2022:
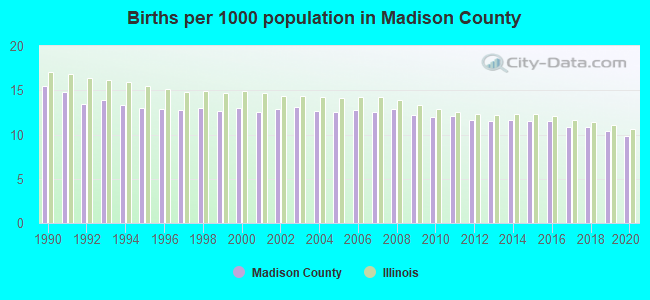
Births per 1000 population from 1990 to 1999: 13.5 Births per 1000 population from 2000 to 2009: 12.7 Births per 1000 population from 2010 to 2024: 10.9
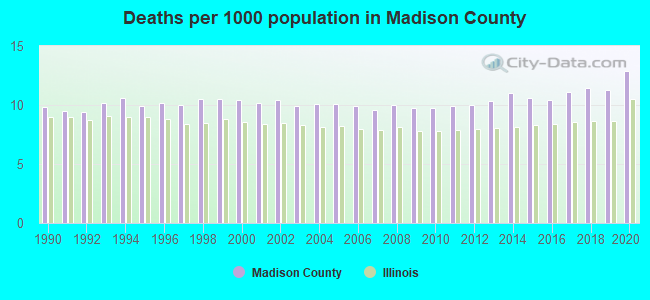
Deaths per 1000 population from 1990 to 1999: 10.1 Deaths per 1000 population from 2000 to 2009: 10.0 Deaths per 1000 population from 2010 to 2020: 10.8
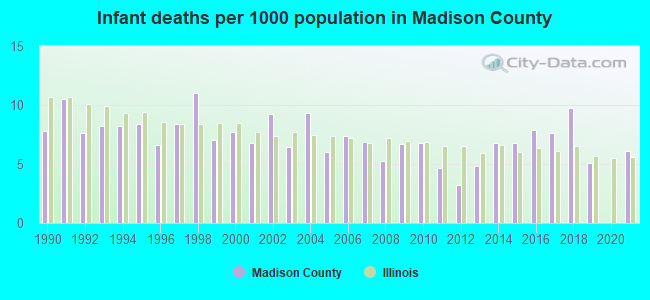
Infant deaths per 1000 live births from 1990 to 1999: 8.4 Infant deaths per 1000 live births from 2000 to 2009: 7.2 Infant deaths per 1000 live births from 2010 to 2023: 5.3
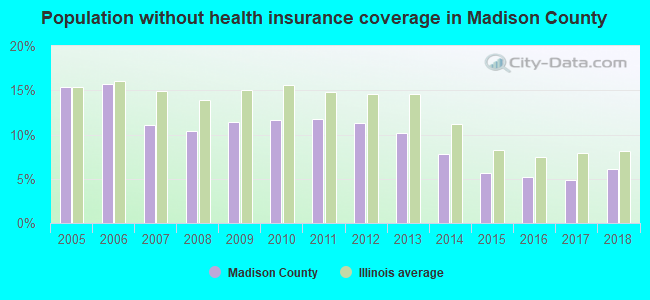
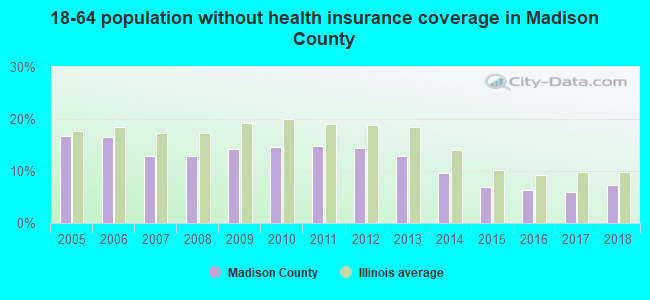
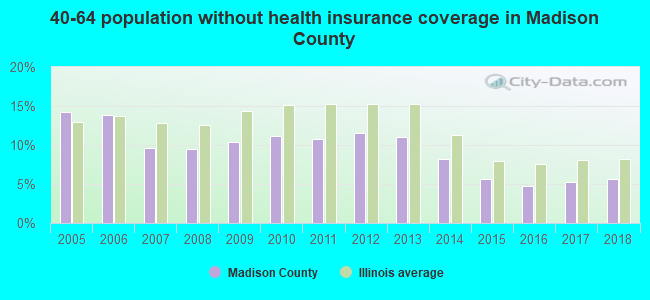
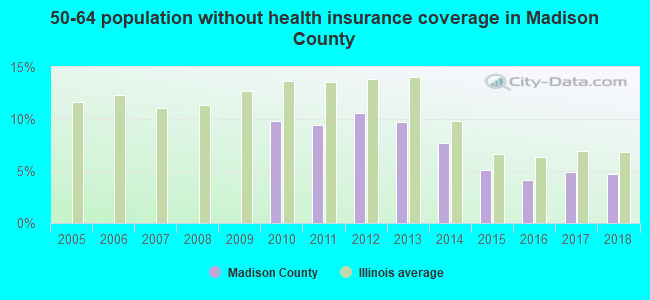
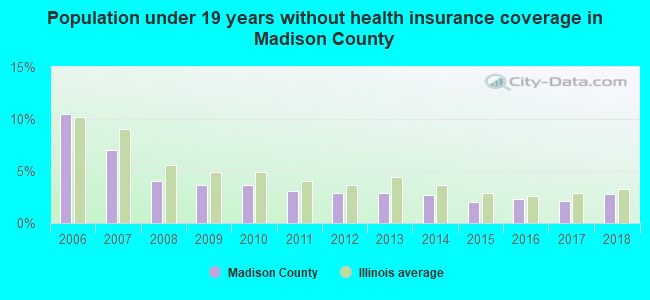
Population without health insurance coverage in 2023: 5.4% Persons under 19 years old without health insurance coverage in 2023: 2.7%
Percentage of population without health insurance coverage in Madison County
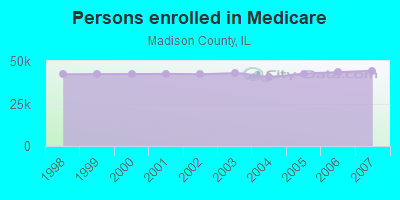
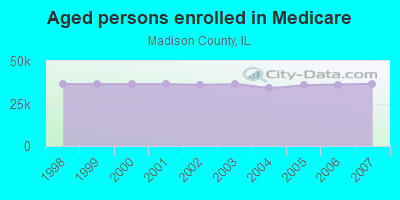
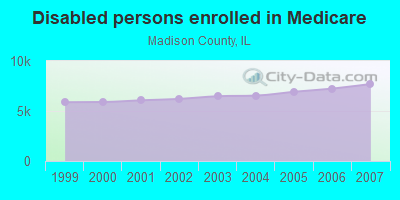
Persons enrolled in hospital insurance and/or supplemental medical insurance (Medicare) in July 1, 2007: 44,298 (36,595 aged, 7,703 disabled) Children under 18 without health insurance coverage in 2007: 3,866 (6%)
Most common underlying causes of death in Madison County, Illinois in 1999 - 2019:
Acute myocardial infarction, unspecified (4,843)
Bronchus or lung, unspecified - Malignant neoplasms (3,895)
Stroke, not specified as haemorrhage or infarction (1,700)
Unspecified dementia (1,622)
Pneumonia, unspecified (1,244)
Colon, unspecified - Malignant neoplasms (945)
Population without health insurance coverage in 2000: 11% Children under 18 without health insurance coverage in 2000: 9%
Short term general hospitals per 100,000 population in 2004: 1.51 Short term general hospital admissions per 100,000 population in 2004: 7,518 Short term general hospital beds per 100,000 population in 2004: 242 Emergency room visits per 100,000 population in 2004: 37,590
General practice office based MDs per 100,000 population in 2005: 1,326 Medical specialist MDs per 100,000 population in 2005: 1,024 Dentists per 100,000 population in 1998: 7
Total births per 100,000 population, July 2005 - July 2006 : 50 Total deaths per 100,000 population, July 2005 - July 2006: 86
Limited-service eating places per 100,000 population in 2005 : 15 Beer, wine & liquor stores per 100,000 population in 2005: 1
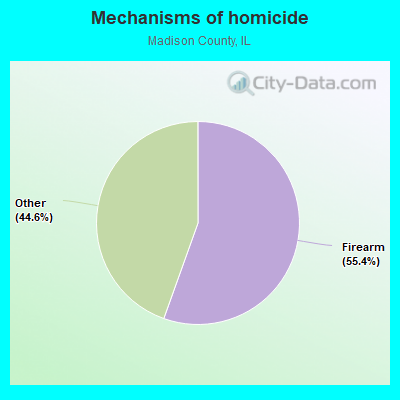
Homicides per 1,000,000 population from 2000 to 2006: 40.2. This is less than state average.
Deaths per 1,000,000 population:
Firearm - 22.3
Other - 17.9
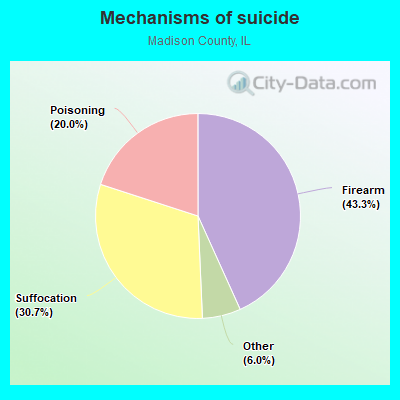
Suicides per 1,000,000 population from 2000 to 2006: 116.9. This is more than state average.
Deaths per 1,000,000 population:
Firearm - 50.6
Suffocation - 35.9
Poisoning - 23.4
Other - 7.1
Household type by relationship:
Households: 263,017
Male householders: 53,202 (17,930 living alone), Female householders: 58,250 (17,240 living alone)
31,471 married couples with children.
14,894 single-parent households (4,464 men, 10,430 women).
95.8% of residents of Madison speak English at home.
2.2% of residents speak Spanish at home (67% speak English very well, 21% speak English well, 10% speak English not well, 2% don't speak English at all).
0.7% of residents speak other Indo-European language at home (80% speak English very well, 15% speak English well, 3% speak English not well, 2% don't speak English at all).
0.6% of residents speak Asian or Pacific Island language at home (54% speak English very well, 36% speak English well, 9% speak English not well, 1% don't speak English at all).
0.3% of residents speak other language at home (89% speak English very well, 11% speak English well).
In fiscal year 2004:
Federal Government expenditure: $1,628,318,000 ($6,160 per capita) Department of Defense expenditure: $143,096,000 Federal direct payments to individuals for retirement and disability: $738,378,000 Federal other direct payments to individuals: $360,039,000 Federal direct payments not to individuals: $13,524,000 Federal grants: $278,831,000 Federal procurement contracts: $194,994,000 ($101,878,000 Department of Defense) Federal salaries and wages: $42,551,000 ($4,832,000 Department of Defense) Federal Government direct loans: $84,491,000 Federal guaranteed/insured loans: $161,913,000 Federal Government insurance: $197,530,000
Population change from April 1, 2000 to July 1, 2005:
Births: 17,749
Here:
67 per 1000 residents
State:
75 per 1000 residents
Deaths: 13,932
Here:
53 per 1000 residents
State:
43 per 1000 residents
Net international migration: +547
Here:
+2 per 1000 residents
State:
+26 per 1000 residents
Net internal migration: +967
Here:
+4 per 1000 residents
State:
-31 per 1000 residents
Total withdrawal of fresh water for public supply: 54.30 millions of gallons per day (21% from ground, 79% from surface)
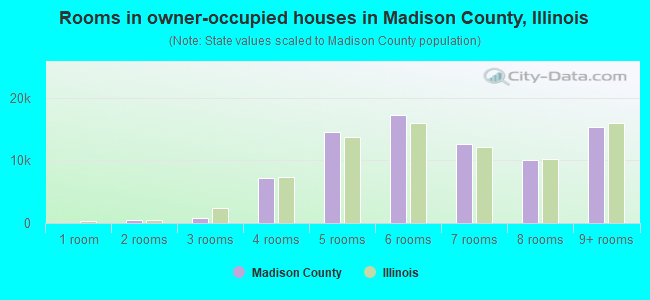
Median number of rooms in houses and condos:
Here:
6.3
State:
6.4
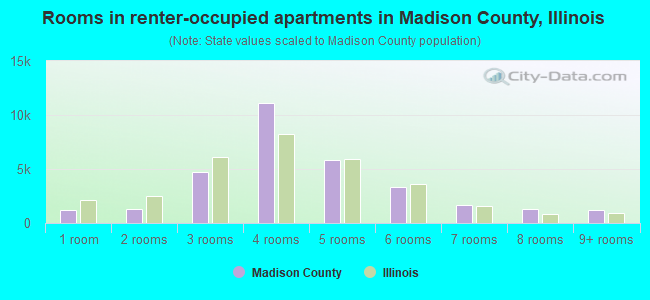
Median number of rooms in apartments:
Here:
4.3
State:
4.0
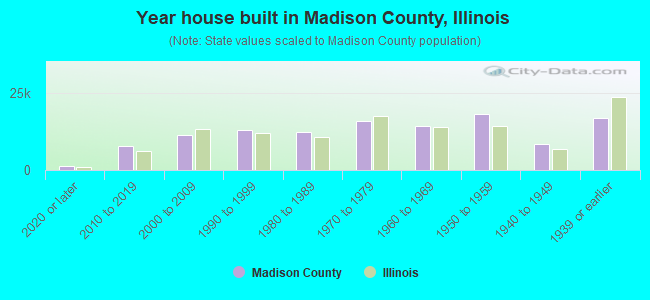
Year house built in Madison County, Illinois
2,1062020 or later
8,2892010 to 2019
16,5572000 to 2009
11,8181990 to 1999
10,9791980 to 1989
15,2801970 to 1979
13,6691960 to 1969
16,4691950 to 1959
7,5971940 to 1949
16,8251939 or earlier
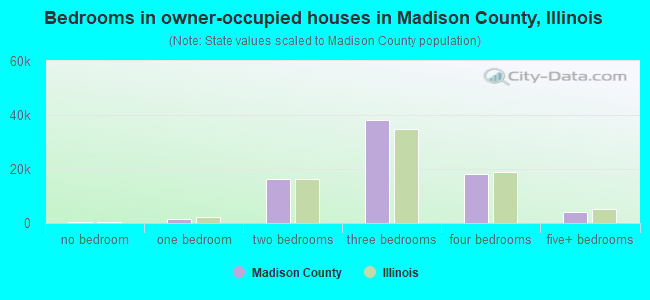
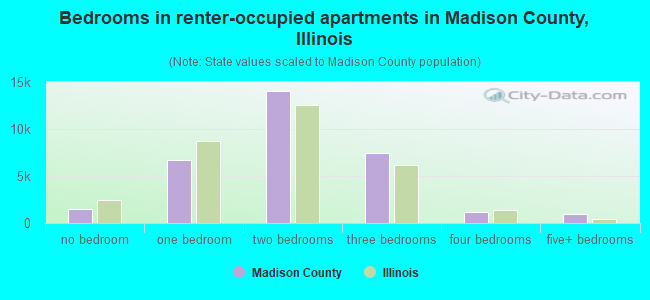
Rooms in houses/apartments in Madison County, Illinois
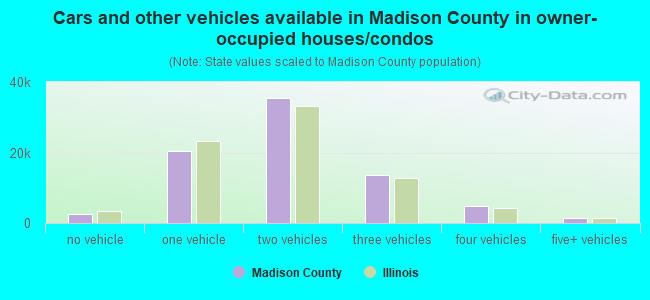
Cars and other vehicles available in Madison County in owner-occupied houses/condos
2,241no vehicle
21,9401 vehicle
33,3372 vehicles
16,3443 vehicles
6,7464 vehicles
2,3355+ vehicles
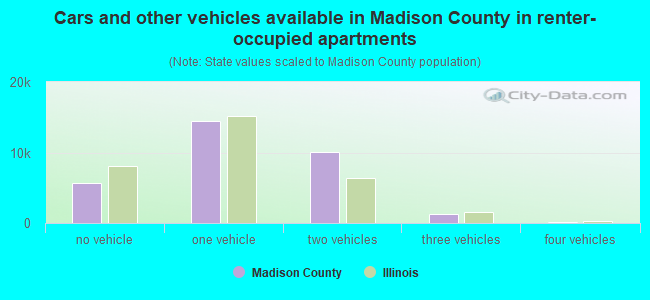
Cars and other vehicles available in Madison County in renter-occupied apartments
3,512no vehicle
16,1151 vehicle
7,1642 vehicles
1,5363 vehicles
1824 vehicles
05+ vehicles
90.0% of Madison County residents lived in the same house 1 years ago. Out of people who lived in different houses, 35% lived in this county. Out of people who lived in different counties, 55% lived in Illinois.
Madison County:
90.0%
State average:
89.8%
Place of birth for U.S.-born residents:
This state: 176,877
Other state: 78,281
Northeast: 3,837
Midwest: 53,078
South: 14,937
West: 6,429
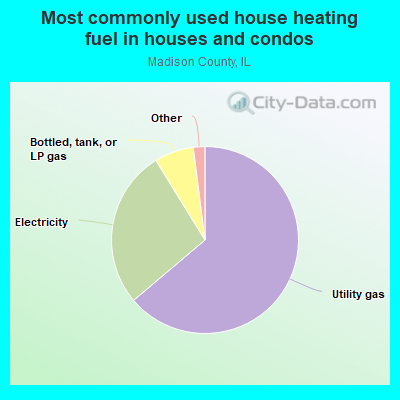
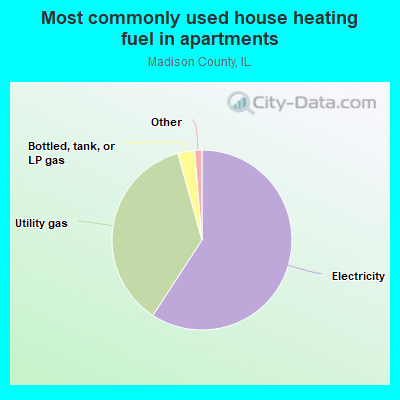
Most commonly used house heating fuel in Madison County
#12 on the list of "Top 101 counties with the largest decrease in the number of infant deaths per 1000 residents 2000-2006 to 2007-2013 (pop. 50,000+)"
#18 on the list of "Top 101 counties with the lowest number of infant deaths per 1000 residents 2007-2013 (pop. 50,000+)"
#26 on the list of "Top 101 counties with the highest Particulate Matter (PM2.5) Annual air pollution readings in 2012 (µg/m3)"
#67 on the list of "Top 101 counties with the lowest percentage of residents relocating from foreign countries between 2010 and 2011"


 (48.9%)
 (51.1%)

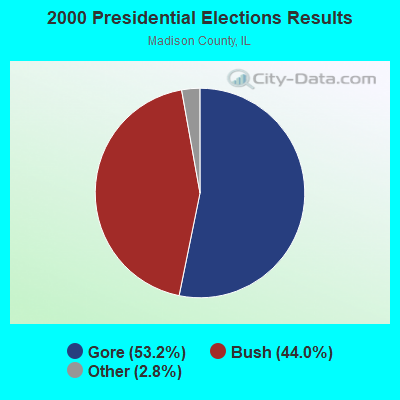
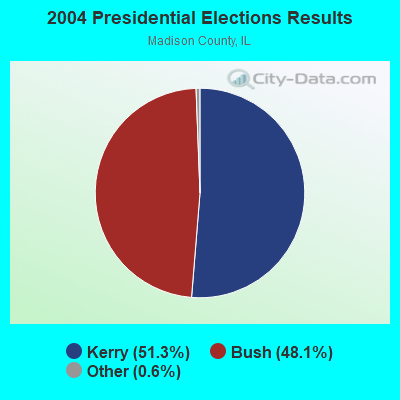
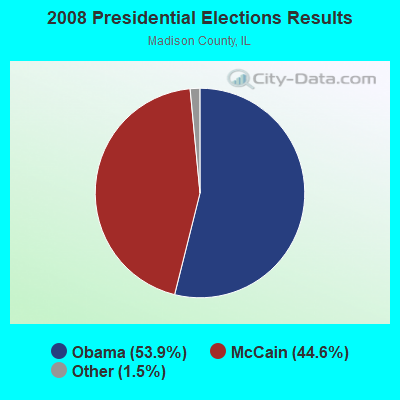
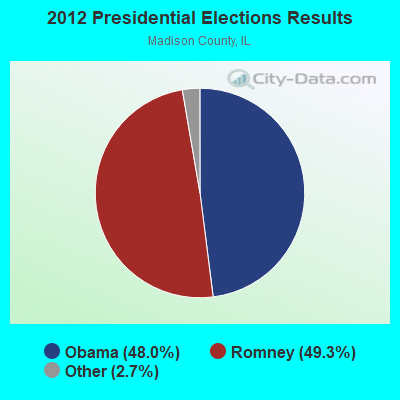
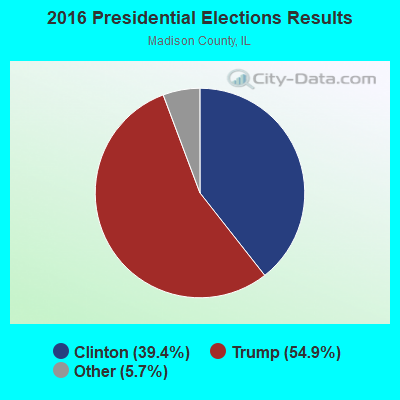
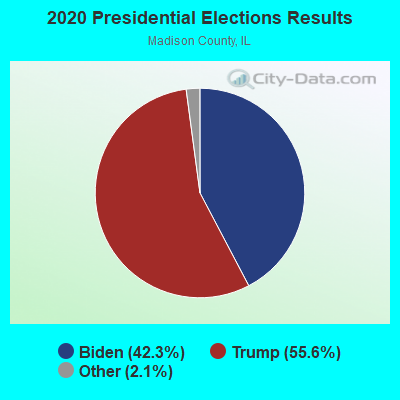

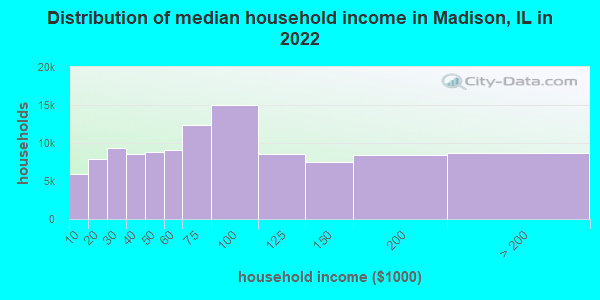
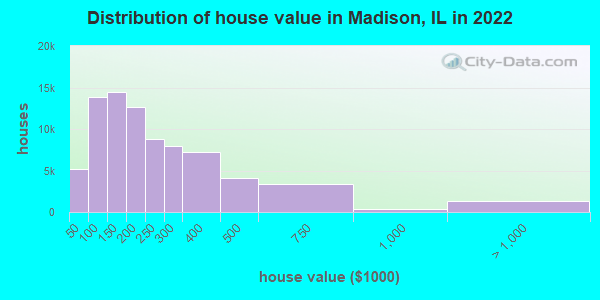
 , Clinton County
  , Jersey County
  , Macoupin County
  , Montgomery County
  , St. Clair County
  , St. Charles County, Missouri
  , St. Louis County, Missouri
  , St. Louis city, Missouri
  .
.
 1.05% ($45,290 average AGI)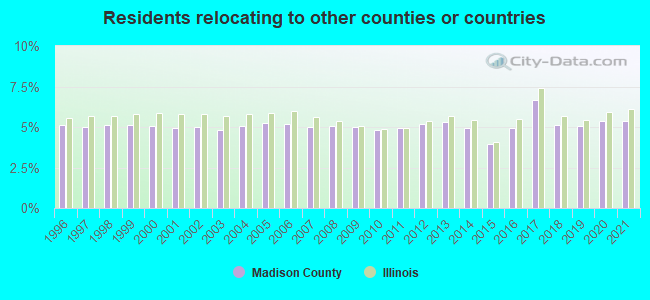

 -31 per 1000 residents