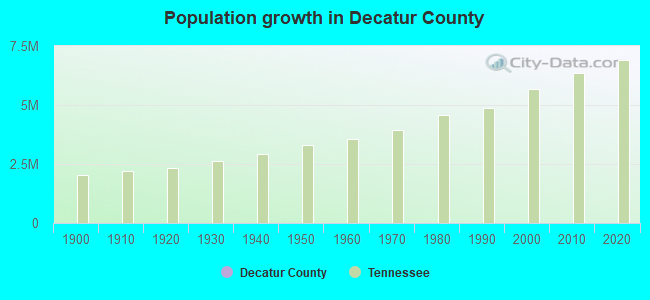
County population in 2024: 11,843 (all rural); it was 11,731 in 2000County owner-occupied with a mortgage or a loan houses and condos in 2020: 1,704 County owner-occupied free and clear houses and condos in 2020: 2,050 County owner-occupied houses and condos in 2000: 3,929, in 2010: 2,078 Renter-occupied apartments: 1,140 (it was 979 in 2000, and 1,093 in 2010)
% of renters here:
20%
State:
23%
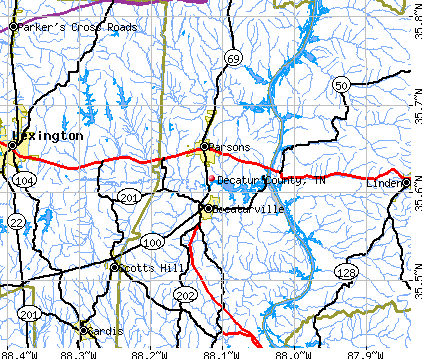
Land area: 334 sq. mi.
Water area: 11.0 sq. mi.
Population density: 35 people per square mile (low).
December 2024 cost of living index in Decatur County: 79.7 (low, U.S. average is 100)
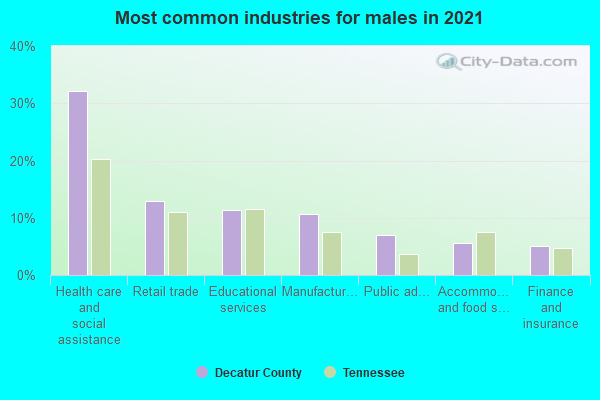
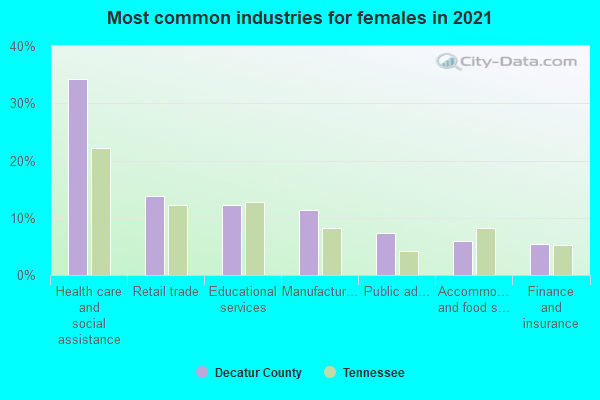
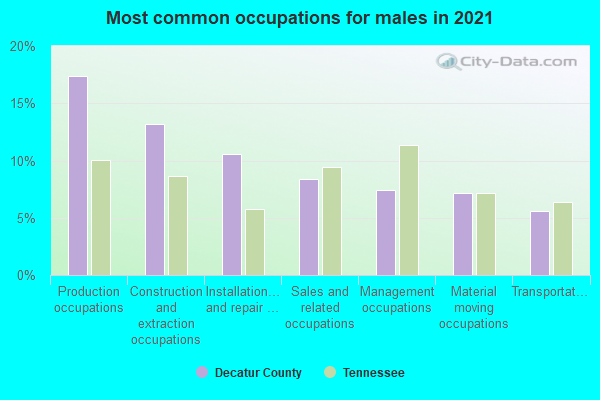
Industries providing employment: Manufacturing (20.5%), Educational, health and social services (19.8%), Retail trade (12.6%).
Median real estate property taxes paid for housing units with mortgages in 2024: $804 (0.4%) Median real estate property taxes paid for housing units with no mortgage in 2024: $596 (0.4%)
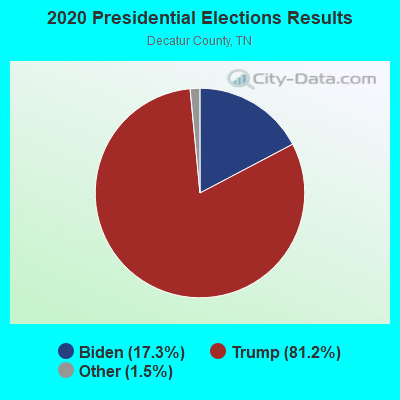
Percentage of residents living in poverty in 2024: 21.7%
Decatur County:
21.7%
Tennessee:
13.5%
(22.2% for White Non-Hispanic residents, 19.4% for Black residents, 13.5% for Hispanic or Latino residents, 100.0% for American Indian residents, 11.0% for two or more races residents)
Median age of residents in 2024: 46.0 years old
(Males: 44.3 years old, Females: 49.0 years old)
(Median age for: White residents: 48.1 years old, Black residents: 46.1 years old, American Indian residents: 39.4 years old, Asian residents: 57.6 years old, Hispanic or Latino residents: 29.5 years old, Other race residents: 2.1 years old)
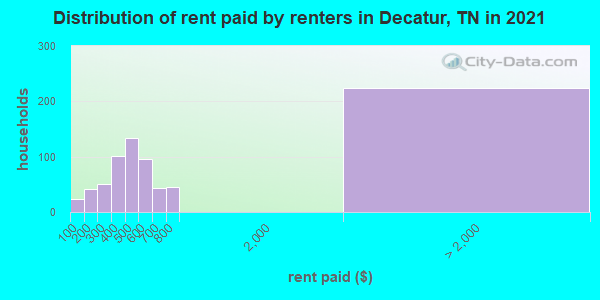
Fair market rent in 2006 for a 1-bedroom apartment in Decatur County is $378 a month. Fair market rent for a 2-bedroom apartment is $460 a month. Fair market rent for a 3-bedroom apartment is $591 a month.
Notable locations in this county outside city limits:
Notable locations in Decatur County: Union Hall (A), Tuckers Store (B), Wheat Store (C), Spences Store (D), Parkers Landing (E), Ponderosa Dock (F), Penny Slough Landing (G), Perryville Marina (H), Double Bridges (I), Decatur Furnace (J), Clifts Landing (K), Cherokee Heights Dock (L), Center Camp Ground (M), Brownsport Furnace (N), Beech River Landing (O), Buckeys Landing (P), Lost Creek Dock (Q), Thwattles Landing (R), Swallow Bluff Landing (S), Turner Landing (T). Display/hide their locations on the map
Churches in Decatur County include: Smith Bottom Church (A), Graves Chapel (B), Liberty Church (C), Mount Carmel Church (D), Unity Church (E), Yellow Spring Church (F), Franks Chapel (G), Rushing Creek Church (H), Rushing Grove Church (I). Display/hide their locations on the map
Cemeteries: Houston Cemetery (1), Ivey Cemetery (2), Tolley Cemetery (3), Shannon Cemetery (4), Tucker Cemetery (5), Jennings Cemetery (6), Turnbo Cemetery (7). Display/hide their locations on the map
Lakes and reservoirs: Cypress Pond (A), Open Pond (B), Deer Pond (C), Bowman Pond (D), Keeton Pond (E), Catfish Haven Reservoir (F), Refish Number Two Lake (G), Refish Number One Lake (H). Display/hide their locations on the map
Streams, rivers, and creeks: Luton Branch (A), Lost Creek (B), Little Creek (C), Lick Creek (D), Beech River (E), Becks Branch (F), Jordan Spring Branch (G), Johnson Creek (H), John Yarbro Branch (I). Display/hide their locations on the map
Parks in Decatur County include: Tanyard Park (1), Beech Bend Recreation Area (2), Alley Bluff Tennessee Valley Authority Wild Area (3), Busseltown Unit Tennessee National Wildlife Refuge (4). Display/hide their locations on the map
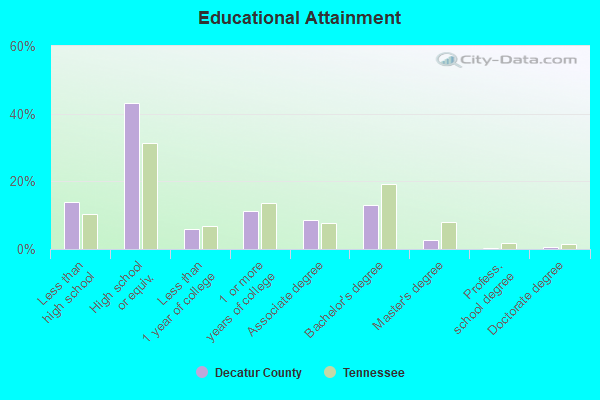
Current college students: 280 People 25 years of age or older with a high school degree or higher: 84.1% People 25 years of age or older with a bachelor's degree or higher: 14.0%
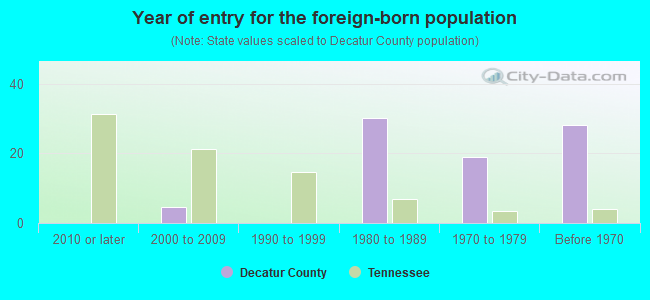
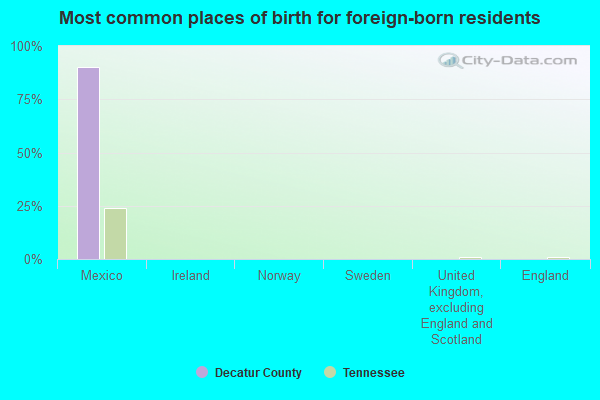
Number of foreign born residents: 299 (31.5% naturalized citizens)
Decatur County:
2.5%
Whole state:
6.5%
Year of entry for the foreign-born population
1482010 or later
912000 to 2009
371990 to 1999
301980 to 1989
191970 to 1979
28Before 1970
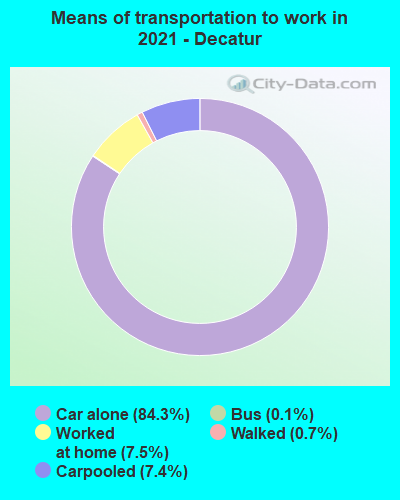
Mean travel time to work (commute): 28 minutes
Percentage of county residents living and working in this county: 97.0%
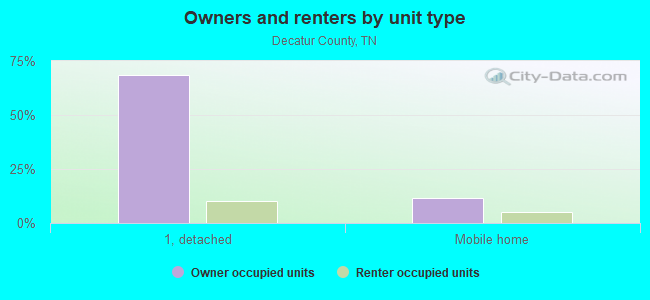
Housing units in structures:
One, detached: 4,987
One, attached: 12
Two: 91
3 or 4: 74
5 to 9: 66
20 to 49: 5
50 or more: 24
Mobile homes: 1,331
Boats, RVs, vans, etc.: 70
Housing units in Decatur County with a mortgage: 1,402 (3 second mortgage, 1 home equity loan, 1 both second mortgage and home equity loan) Houses without a mortgage: 4
Here:
20.0% with mortgage
State:
97.5% with mortgage
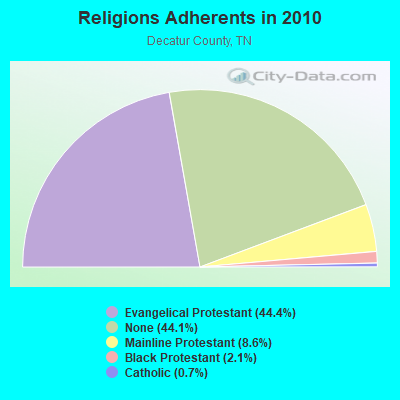
Religion statistics for Decatur County
Religion
Adherents
Congregations
Evangelical Protestant
5,215
37
Mainline Protestant
1,013
11
Black Protestant
251
4
Catholic
88
1
Other
-
-
None
5,190
-
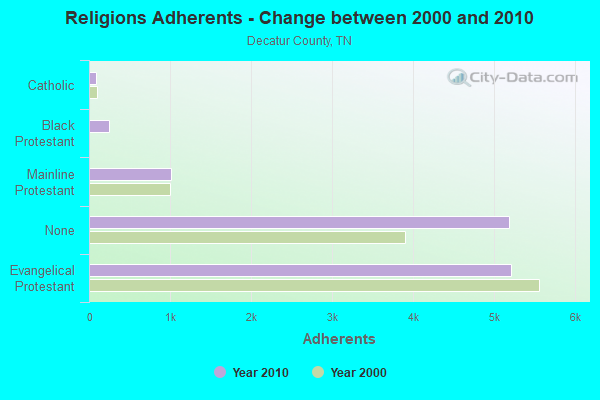
Decatur County Religion Details
Source: Clifford Grammich, Kirk Hadaway, Richard Houseal, Dale E.Jones, Alexei Krindatch, Richie Stanley and Richard H.Taylor. 2012. 2010 U.S.Religion Census: Religious Congregations & Membership Study. Association of Statisticians of American Religious Bodies. Jones, Dale E., et al. 2002. Congregations and Membership in the United States 2000. Nashville, TN: Glenmary Research Center.
Food Environment Statistics:
Number of grocery stores: 5
Decatur County:
4.41 / 10,000 pop.
State:
1.99 / 10,000 pop.
Number of convenience stores (no gas): 3
This county:
2.65 / 10,000 pop.
Tennessee:
0.65 / 10,000 pop.
Number of convenience stores (with gas): 12
Decatur County:
10.60 / 10,000 pop.
Tennessee:
5.16 / 10,000 pop.
Number of full-service restaurants: 11
This county:
9.71 / 10,000 pop.
State:
6.56 / 10,000 pop.
Adult diabetes rate:
Decatur County:
12.4%
Tennessee:
11.4%
Adult obesity rate:
Decatur County:
27.9%
State:
30.2%
Low-income preschool obesity rate:
Here:
11.8%
State:
13.5%
Agriculture in Decatur County:
Average size of farms: 202 acres Average value of agricultural products sold per farm: $9,932 Average value of crops sold per acre for harvested cropland: $82.07 The value of nursery, greenhouse, floriculture, and sod as a percentage of the total market value of agricultural products sold: 5.52% The value of livestock, poultry, and their products as a percentage of the total market value of agricultural products sold: 64.79% Average total farm production expenses per farm: $12,201 Harvested cropland as a percentage of land in farms: 21.14% Irrigated harvested cropland as a percentage of land in farms: 0.33% Average market value of all machinery and equipment per farm: $48,105 The percentage of farms operated by a family or individual: 90.87% Average age of principal farm operators: 57 years Average number of cattle and calves per 100 acres of all land in farms: 12.97 Corn for grain: 1786 harvested acres Soybeans for beans: 4915 harvested acres Vegetables: 20 harvested acres
Tornado activity:
Decatur County historical area-adjusted tornado activity is significantly below Tennessee state average. It is 11026093.3 times below overall U.S. average.
Earthquake activity:
Decatur County-area historical earthquake activity is slightly above Tennessee state average. It is 53% smaller than the overall U.S. average.
On 4/18/2008 at 09:36:59, a magnitude 5.4 (5.1 MB, 4.8 MS, 5.4 MW, 5.2 MW, Class: Moderate, Intensity: VI - VII) earthquake occurred 196.6 miles away from Decatur County center On 5/4/1991 at 01:18:54, a magnitude 5.0 (4.4 MB, 4.6 LG, 5.0 LG, Depth: 3.1 mi) earthquake occurred 115.8 miles away from the county center On 3/25/1976 at 00:41:20, a magnitude 5.0 (4.9 MB, 5.0 LG) earthquake occurred 124.3 miles away from the county center On 9/26/1990 at 13:18:51, a magnitude 5.0 (4.7 MB, 4.8 LG, 5.0 LG, Depth: 7.7 mi) earthquake occurred 133.3 miles away from the county center On 4/18/2008 at 09:36:59, a magnitude 5.2 (5.2 MW, Depth: 8.9 mi) earthquake occurred 196.6 miles away from Decatur County center On 4/27/1989 at 16:47:49, a magnitude 4.7 (4.6 MB, 4.7 LG, 4.3 LG, Class: Light, Intensity: IV - V) earthquake occurred 96.5 miles away from the county center Magnitude types: regional Lg-wave magnitude (LG), body-wave magnitude (MB), surface-wave magnitude (MS), moment magnitude (MW)
Tennessee Severe Thunderstorms and Possible Strong Tornadoes, Incident Period: Mar 1, 2023 - Mar 3, 2023, FEMA Id: 4712, Natural disaster type: Storm, Tornado
Tennessee Severe Storms, Straight-line Winds, and Tornadoes, Incident Period: Dec 10, 2021 - Dec 11, 2021, FEMA Id: 3576, Natural disaster type: Storm, Tornado, Wind
Tennessee Severe Storms, Straight-line Winds, and Tornadoes, Incident Period: Dec 10, 2021 - Dec 11, 2021, FEMA Id: 4637, Natural disaster type: Storm, Tornado, Wind
Tennessee Severe Storms, Tornadoes, and Flooding, Incident Period: Mar 25, 2021 - Apr 3, 2021, FEMA Id: 4601, Natural disaster type: Storm, Tornado, Flood
Tennessee Severe Storms, Straight-line Winds, And Flooding, Incident Period: May 3, 2020 - May 4, 2020, Major Disaster (Presidential) Declared DR-4550-TN: July 9, 2020, FEMA Id: 4550, Natural disaster type: Storm, Flood, Wind
Tennessee Covid-19, Incident Period: Jan 20, 2020 - May 11, 2023, FEMA Id: 3473, Natural disaster type: Other
Tennessee Covid-19 Pandemic, Incident Period: January 20, 2020, FEMA Id: 4514, Natural disaster type: Other
Tennessee Severe Storm And Straight-line Winds, Incident Period: October 26, 2019, FEMA Id: 4471, Natural disaster type: Storm, Wind
Tennessee Severe Storms, Flooding, Landslides, And Mudslides, Incident Period: February 19, 2019 - March 30, 2019, FEMA Id: 4427, Natural disaster type: Storm, Mudslide, Landslide, Flood
15 other natural disasters have been reported since 1953.
The number of natural disasters in Decatur County (25) is greater than the US average (19). Major Disasters (Presidential) Declared: 15 Emergencies Declared: 1
Causes of natural disasters: Storms: 20, Floods: 15, Tornadoes: 13, Winds: 9, Flash Flood: 1, Hurricane: 1, Ice Storm: 1, Landslide: 1, Mudslide: 1, Winter Storm: 1, Other: 2 (Note: some incidents may be assigned to more than one category).
Installation, maintenance, and repair occupations (9%)
Material moving occupations (7%)
Sales and related occupations (7%)
Food preparation and serving related occupations (6%)
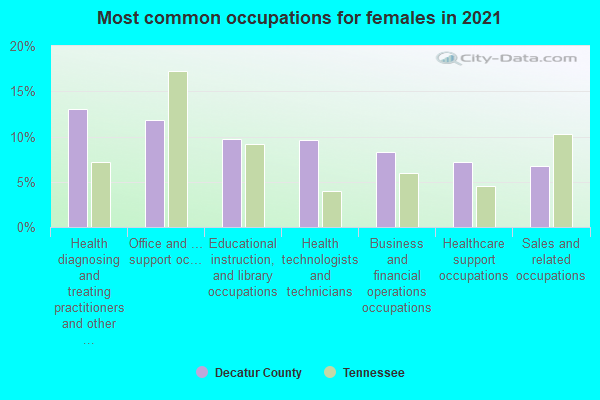
Office and administrative support occupations (19%)
Health technologists and technicians (10%)
Health diagnosing and treating practitioners and other technical occupations (10%)
Material moving occupations (7%)
Sales and related occupations (7%)
Educational instruction, and library occupations (6%)
Food preparation and serving related occupations (6%)
India (37%)
Mexico (24%)
Honduras (12%)
Brazil (4%)
Norway (4%)
Italy (3%)
Guatemala (3%)
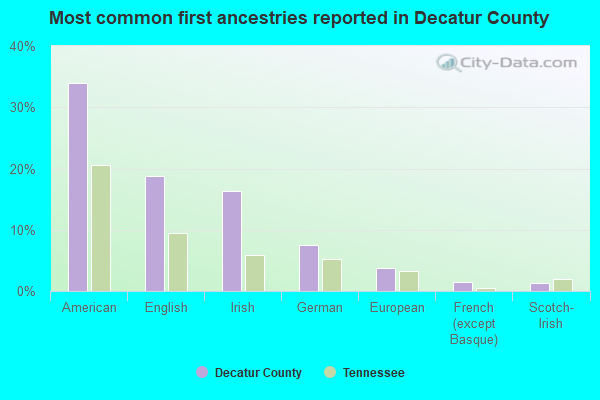
American (31%)
English (18%)
Irish (13%)
German (4%)
African (3%)
Italian (3%)
Scottish (2%)
142 people in nursing facilities/skilled-nursing facilities
39 people in correctional facilities for adults
186 people in nursing facilities/skilled-nursing facilities
27 people in local jails and other municipal confinement facilities
219 people in nursing homes
11 people in local jails and other confinement facilities (including police lockups)Average gross adjusted income of non-migrant taxpayers in this county in 2021 was $57,418.
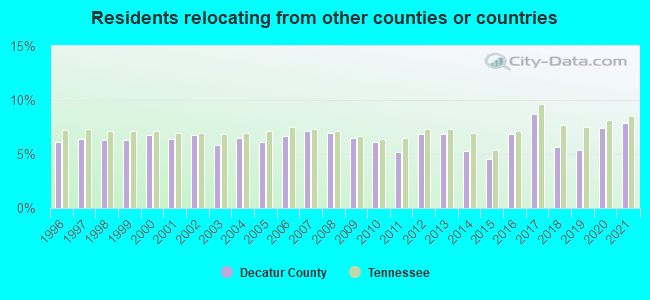
8.31% of this county's 2022 resident taxpayers lived in other counties in 2021 ($51,974 average adjusted gross income)
Here:
8.31%
Tennessee average:
8.20%
10 or fewer of this county's residents moved from foreign countries.
5.09% relocated from other counties in Tennessee ($29,388 average AGI)
3.22% relocated from other states ($22,589 average AGI)
Decatur County:
3.22%
Tennessee average:
4.33%
Top counties from which taxpayers relocated into this county between 2021 and 2022:
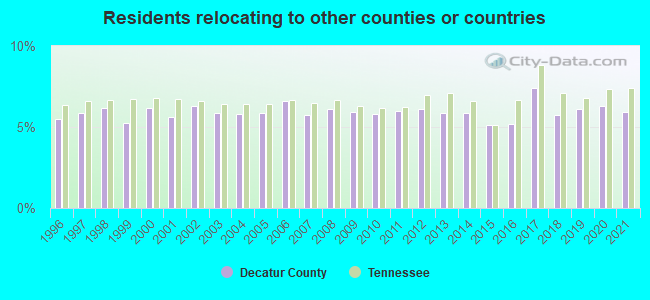
5.45% of this county's 2021 resident taxpayers moved to other counties in 2022 ($38,734 average adjusted gross income)
Here:
5.45%
Tennessee average:
7.13%
10 or fewer of this county's residents moved to foreign countries.
4.47% relocated to other counties in Tennessee ($30,064 average AGI)
0.97% relocated to other states ($8,670 average AGI)
Decatur County:
0.97%
Tennessee average:
3.22%
Top counties to which taxpayers relocated from this county between 2021 and 2022:
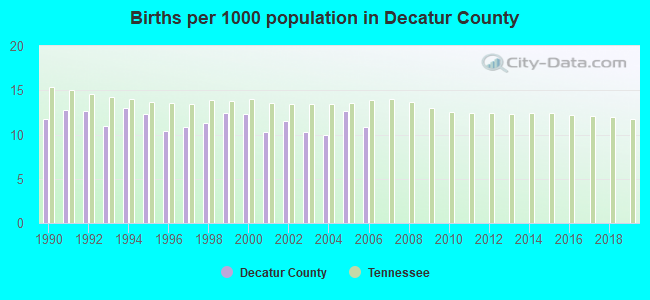
Births per 1000 population from 1990 to 1999: 11.8 Births per 1000 population from 2000 to 2006: 11.1
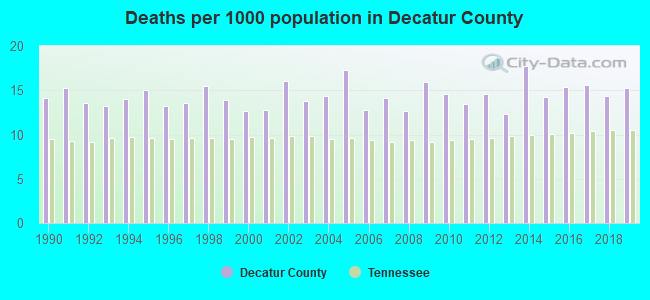
Deaths per 1000 population from 1990 to 1999: 14.1 Deaths per 1000 population from 2000 to 2009: 14.3 Deaths per 1000 population from 2010 to 2020: 15.3
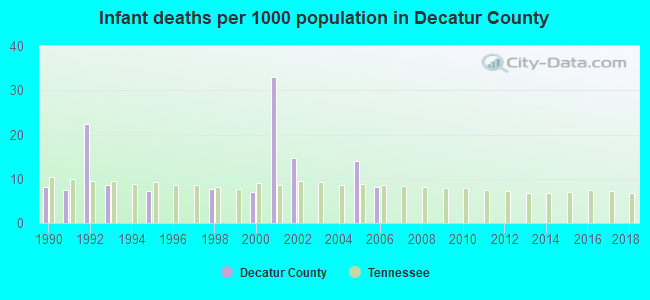
Infant deaths per 1000 live births from 1990 to 1999: 6.1 Infant deaths per 1000 live births from 2000 to 2006: 11.0
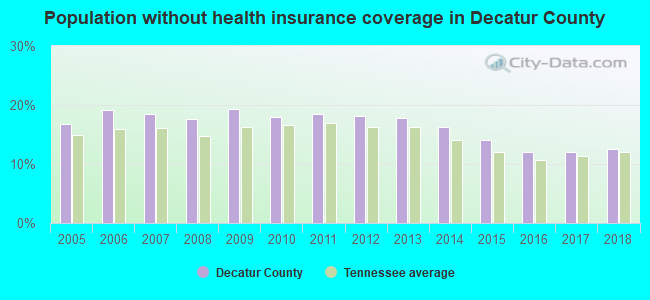
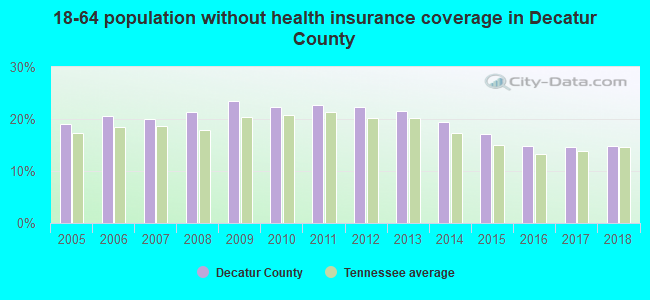
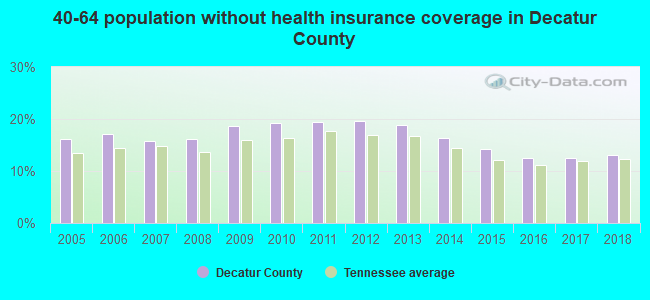
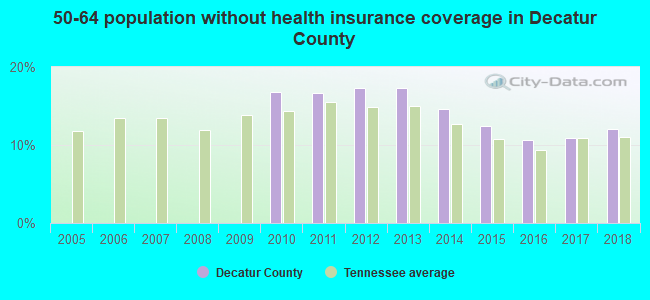
Population without health insurance coverage in 2023: 12.2% Persons under 19 years old without health insurance coverage in 2023: 6.4%
Percentage of population without health insurance coverage in Decatur County
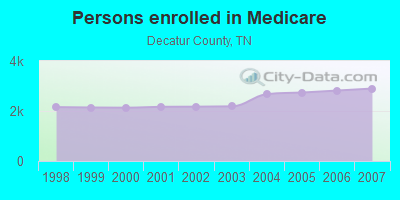
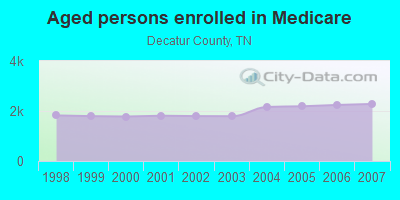
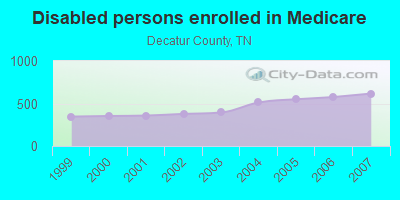
Persons enrolled in hospital insurance and/or supplemental medical insurance (Medicare) in July 1, 2007: 2,898 (2,281 aged, 617 disabled) Children under 18 without health insurance coverage in 2007: 332 (13%)
Most common underlying causes of death in Decatur County, Tennessee in 1999 - 2019:
Acute myocardial infarction, unspecified (533)
Bronchus or lung, unspecified - Malignant neoplasms (215)
Population without health insurance coverage in 2000: 15% Children under 18 without health insurance coverage in 2000: 10%
Short term general hospitals per 100,000 population in 2004: 8.58 Short term general hospital admissions per 100,000 population in 2004: 9,708 Short term general hospital beds per 100,000 population in 2004: 343 Emergency room visits per 100,000 population in 2004: 58,695
General practice office based MDs per 100,000 population in 2005: 864 Medical specialist MDs per 100,000 population in 2005: 1,540 Dentists per 100,000 population in 1998: 9
Total births per 100,000 population, July 2005 - July 2006 : 28 Total deaths per 100,000 population, July 2005 - July 2006: 51
Limited-service eating places per 100,000 population in 2005 : 17
Crimes per 100,000 population in 1996: 1
Household type by relationship:
Households: 11,843
Male householders: 2,279 (688 living alone), Female householders: 2,457 (693 living alone)
Size of family households: 1,646 2-persons, 569 3-persons, 464 4-persons, 160 5-persons, 274 6-persons, 73 7-or-more-persons.
Size of nonfamily households: 1,382 1-person, 185 2-persons.
1,451 married couples with children.
255 single-parent households (73 men, 182 women).
96.0% of residents of Decatur speak English at home.
2.0% of residents speak Spanish at home (56% speak English very well, 37% speak English well, 7% speak English not well).
1.7% of residents speak other Indo-European language at home (96% speak English very well, 4% speak English well).
0.2% of residents speak Asian or Pacific Island language at home (100% speak English very well).
In fiscal year 2004:
Federal Government expenditure: $80,933,000 ($6,947 per capita) Department of Defense expenditure: $1,789,000 Federal direct payments to individuals for retirement and disability: $30,852,000 Federal other direct payments to individuals: $26,965,000 Federal direct payments not to individuals: $553,000 Federal grants: $19,527,000 Federal procurement contracts: $606,000 ($0,000 Department of Defense) Federal salaries and wages: $2,429,000 ($481,000 Department of Defense) Federal Government direct loans: $2,531,000 Federal guaranteed/insured loans: $1,822,000 Federal Government insurance: $3,951,000
Population change from April 1, 2000 to July 1, 2005:
Births: 654
Here:
56 per 1000 residents
State:
69 per 1000 residents
Deaths: 836
Here:
72 per 1000 residents
State:
50 per 1000 residents
Net international migration: +70
Here:
+6 per 1000 residents
State:
+8 per 1000 residents
Net internal migration: +90
Here:
+8 per 1000 residents
State:
+18 per 1000 residents
Total withdrawal of fresh water for public supply: 1.33 millions of gallons per day (16% from ground, 84% from surface)
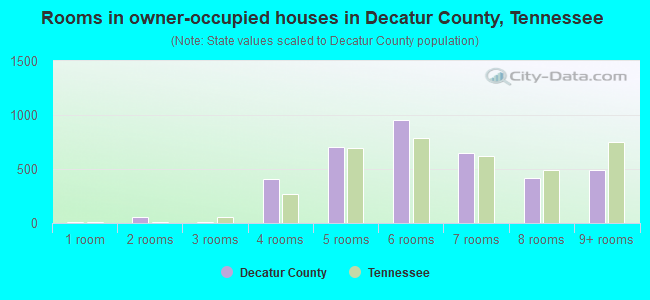
Median number of rooms in houses and condos:
Here:
6.2
State:
6.5
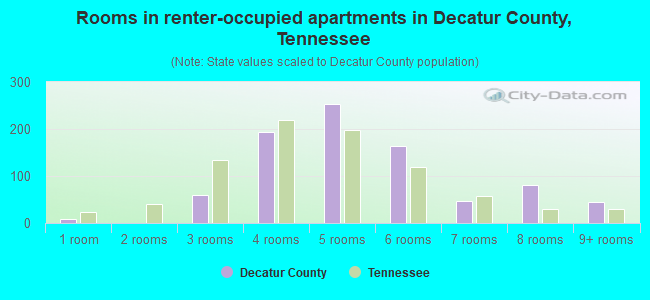
Median number of rooms in apartments:
Here:
4.8
State:
4.4
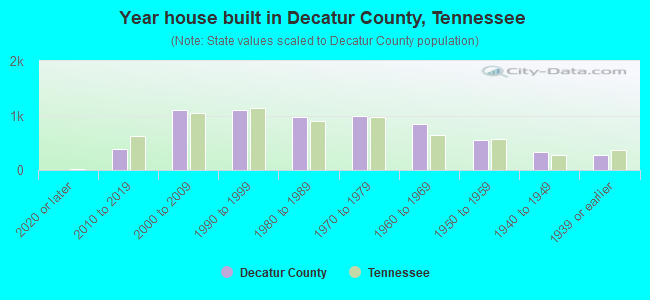
Year house built in Decatur County, Tennessee
1842020 or later
7052010 to 2019
9542000 to 2009
1,0291990 to 1999
8441980 to 1989
1,1841970 to 1979
8221960 to 1969
4921950 to 1959
2771940 to 1949
1691939 or earlier
Rooms in houses/apartments in Decatur County, Tennessee
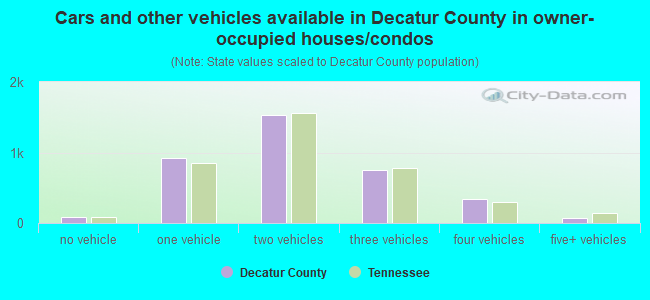
Cars and other vehicles available in Decatur County in owner-occupied houses/condos
159no vehicle
8271 vehicle
1,2282 vehicles
7823 vehicles
3234 vehicles
2085+ vehicles
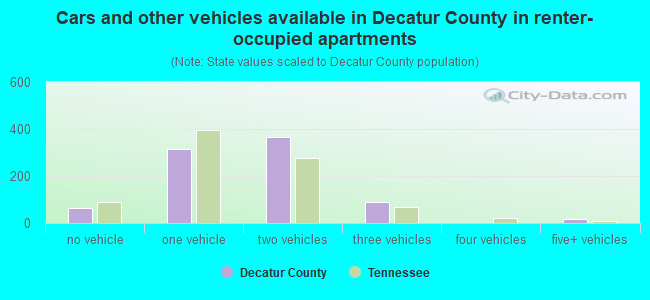
Cars and other vehicles available in Decatur County in renter-occupied apartments
128no vehicle
4031 vehicle
5812 vehicles
923 vehicles
04 vehicles
175+ vehicles
92.9% of Decatur County residents lived in the same house 1 years ago. Out of people who lived in different houses, 33% lived in this county. Out of people who lived in different counties, 64% lived in Tennessee.
Decatur County:
92.9%
State average:
87.8%
Place of birth for U.S.-born residents:
This state: 8,551
Other state: 2,773
Northeast: 249
Midwest: 997
South: 1,140
West: 387
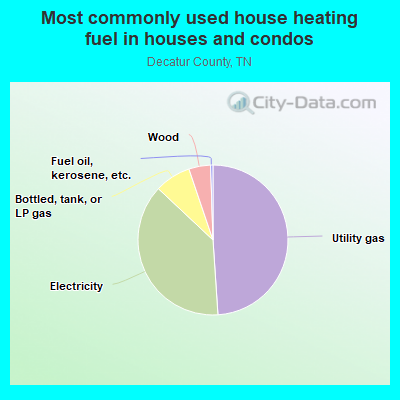
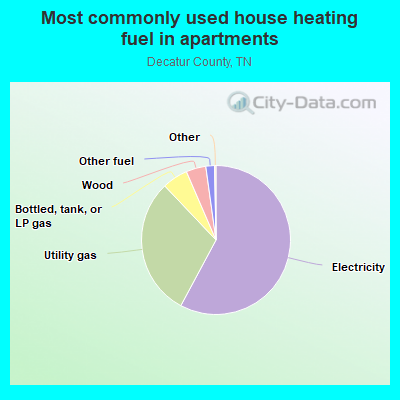
Most commonly used house heating fuel in Decatur County


 , Carroll County
  , Hardin County
  , Henderson County
  , Perry County
  , Wayne County
  .
.