Forseti Instrumentation using OpenCensus#2317
Conversation


…Stackdriver Trace
* Shorten import statements
* Fix > 80 characters lines
* Fix unittests by falling back on FileExporter
…n / off (#2)

* Add support for additional interceptors.

* Add server CLI flag `--enable-tracing`.

* Make tracing libraries optional. Install them using `pip install .[tracing]`.

* Pass `--enable-tracing` in `systemctl` script (default toggle for deployments)

* Add logging to exporter and tracer
* Add tracing libs

* Style fixes, consistent naming

* Fix linting + add tests

 blueandgold
left a comment
blueandgold
left a comment
blueandgold
left a comment
There was a problem hiding this comment.
In looking at your actual results, there are a few things that are missing or can be added to be more helpful.
| # See the License for the specific language governing permissions and | ||
| # limitations under the License. | ||
|
|
||
| """Forseti OpenCensus gRPC tracing setup.""" |
There was a problem hiding this comment.
Can you please point me to the where the outer_wrapper, inner_wrapper pattern is documented or re-implemented from? My ultimate question is if these code are necessary to add to our codebase.

|
@blueandgold Would you mind if we add that as a subsequent PR ? This one was supposed to be a base for tracing (core tracing setup), but I'm open to meet up with Forseti team to determine what's to be traced further and make more PRs. It's been a while that this PR has been open (and stalled multiple times), I'd like to see this merged asap if possible, especially when this is interleaved with the Terraform PR that was already reverted once because this one didn't make it in the last release. Also, seems like tracing deeper functions would fit more with profiling (using e.g Stackdriver Profiling), and not tracing. Tracing is intended to understand overall latency of gRPC / HTTP calls and understand dependencies between services. Profiling will help with debugging time / perf for individual methods. We can add Stackdriver Profiling in a separate PR as well, using the same logic with an Thanks ! |

|
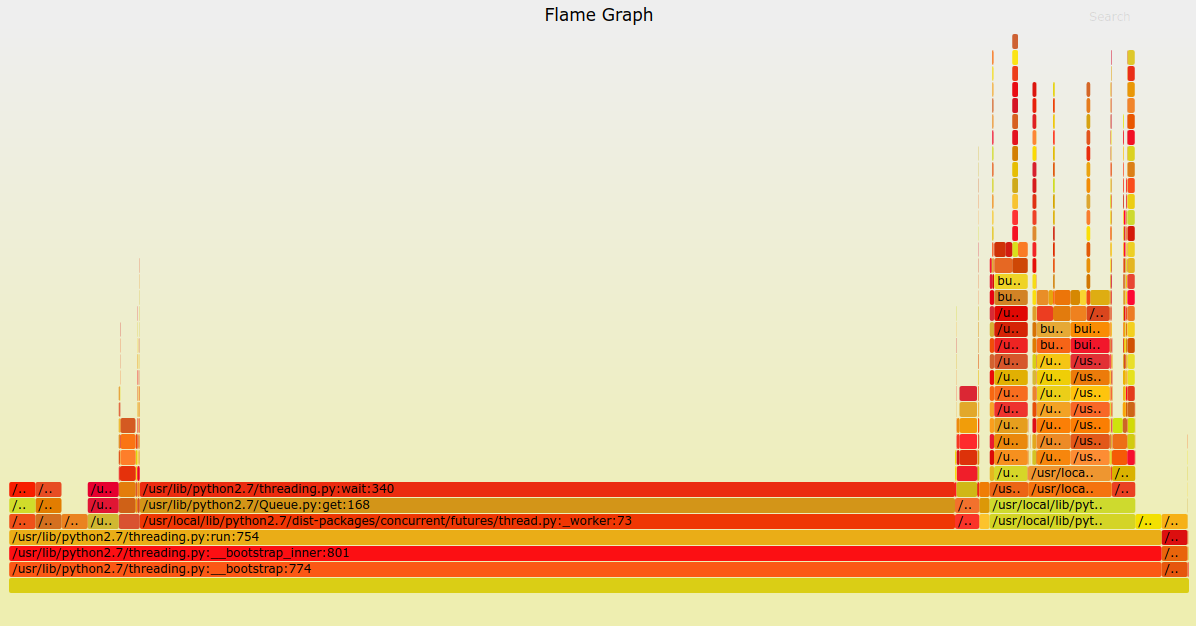
Thanks @ocervell for the great explanation here. A few thoughts: If tracing is what you described (overall latency of gRPC / HTTP calls, and dependencies between services), then we should at a minimum be able to see API calls for CAI, GSuite, or any other APIs calls that we might not be aware of, and we want to spot. As for workflow, it would be nice to keep the work going in this feature branch, and merge it into What we ultimately want is to answer is the question of We can meet to discuss more on this. |
|
Agree with the comment on tracing API calls, however there is no support for this in the Tracing can help to identify slow services, but is not often used to investigate which functions have performance issues. We chose to add detailed traces and spans because at that time, the Stackdriver Profiler was not available for Python3 and Stackdriver Trace was already GA. Traces can also be useful when correlated with logs when incidents happen (see this excellent post). That would have been part 2 of this work. Seems like profiling can fit your specific use case better, which is to debug unidentified slow functions. I recommend using Keeping this PR up-to-date with |

|
Another item that is worth mentioning: the 85,000 ms (1.4 minutes) in the result is the tracing time, not the time to create inventory, which is what we need to measure & analyze how long inventory is taking. |
|
Hi @ocervell, thanks for your great effort & work here. We will need to think about how to leverage it, given that we need to manually record the spans on all the functions that we want, vs identifying problem under the hood that we may not know about but need to find out easily. As well as what you mentioned, the need to support |
|
@red2k18 @ocervell On further testing this PR, I am not able to to see any tracing output when running in my local dev environment. This was working before on 8/8, and nothing has changed in my dev environment. In my IDE output, I see a lot of these error messages like below. I found the original issue where @ocervell resolved with this PR. But I am not sure if or how this ties to the problem I'm experiencing. Any advice? |
|
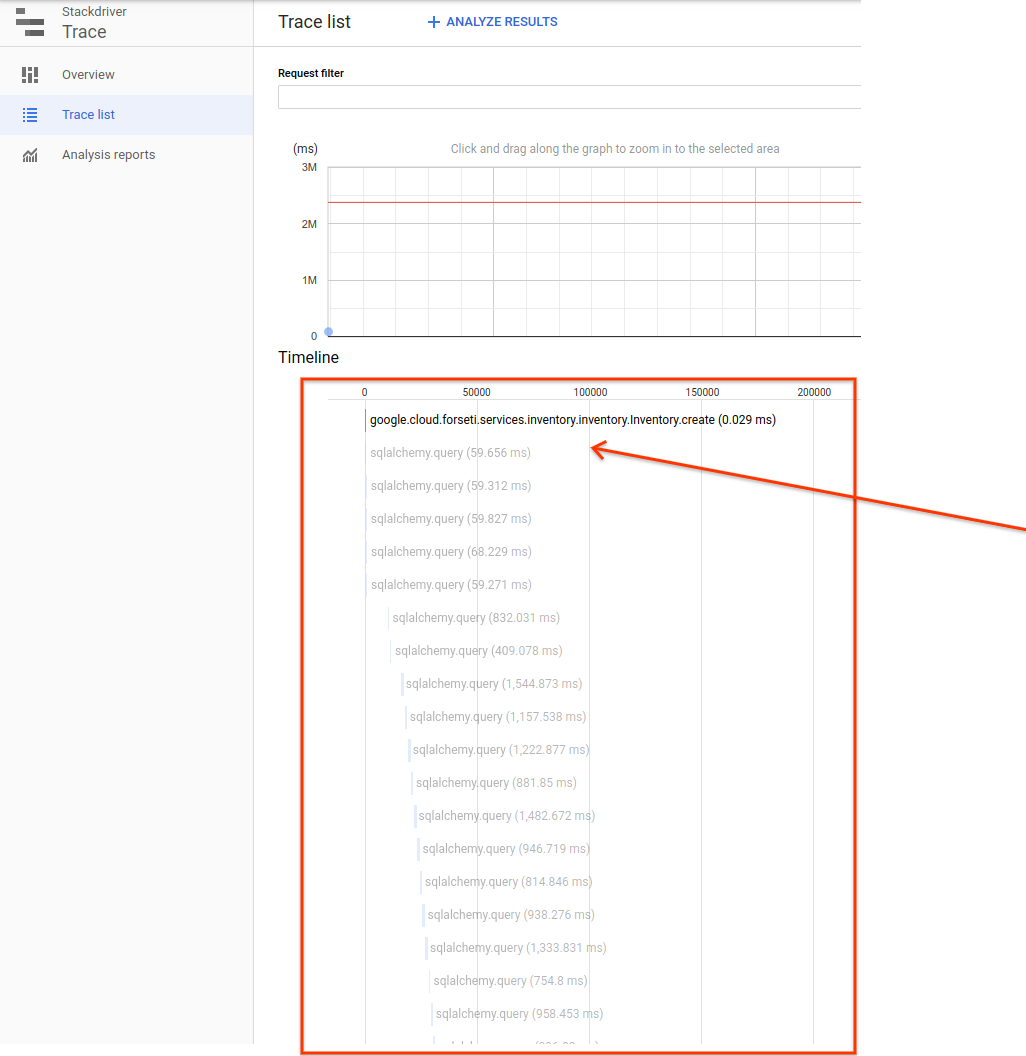
Another thing to figure out for the release is why the UI is greyed out. This is from your project, and I am also seeing it too in my project. |
|
The stackdriver error will be fixed by this PR in the Open Census python client library. |
|
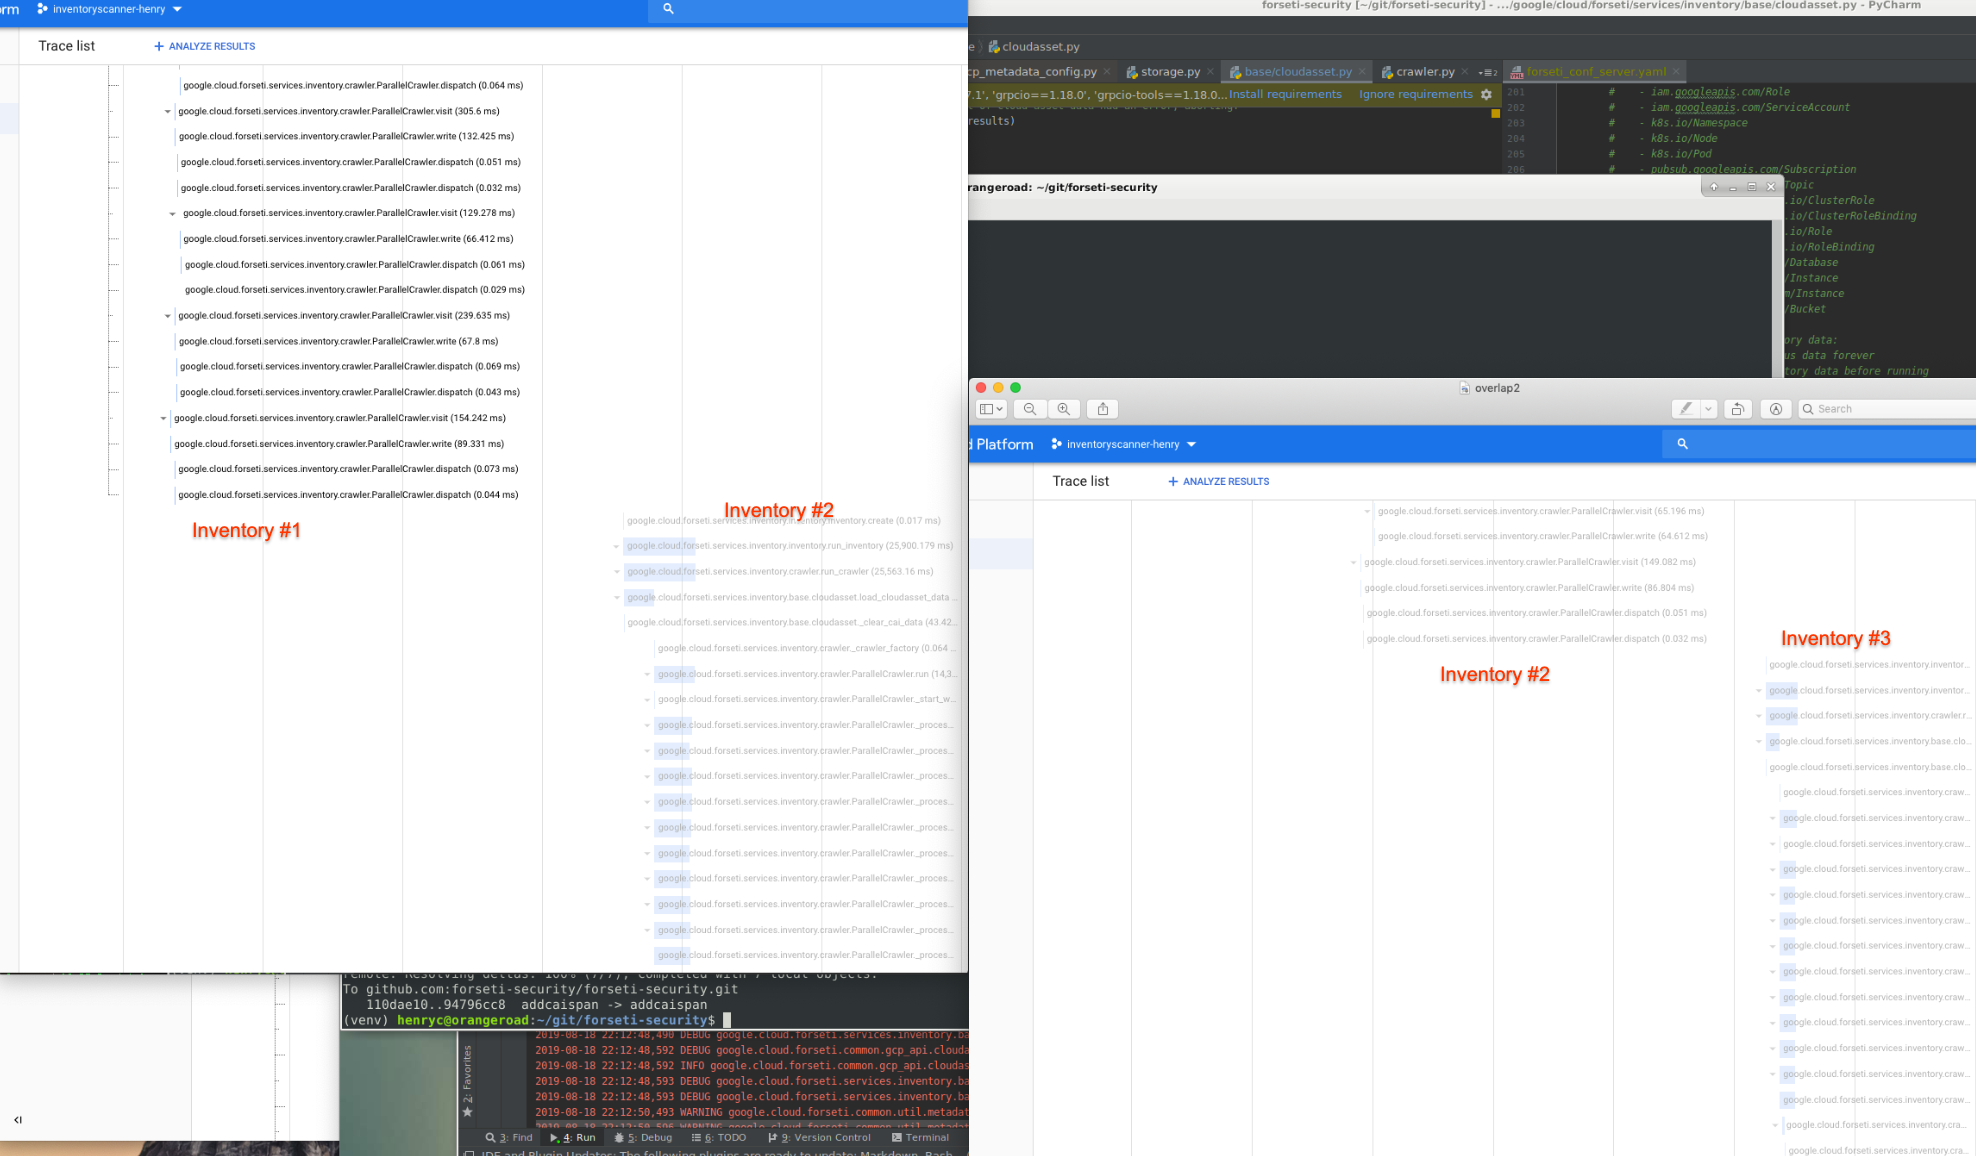
I noticed a weird behavior. If I run the If I restart the server, then the next time I run the inventory create command, a new trace would be produced.
|
| super(Crawler, self).__init__() | ||
| self.config = config | ||
|
|
||
| @tracing.trace() |

There was a problem hiding this comment.
@blueandgold goal is to decorate only the methods that we need to trace, otherwise runtime will increase for the background thread exporting the spans. I'm not sure about which specific methods should be traced, so I've put it on most methods here. Let me know if you have an idea of which ones should / should not be traced.
|
@blueandgold tracing interceptors are added when server boots up which generates a new trace id dynamically. Until then same trace id is used. This is expected behavior. |
|
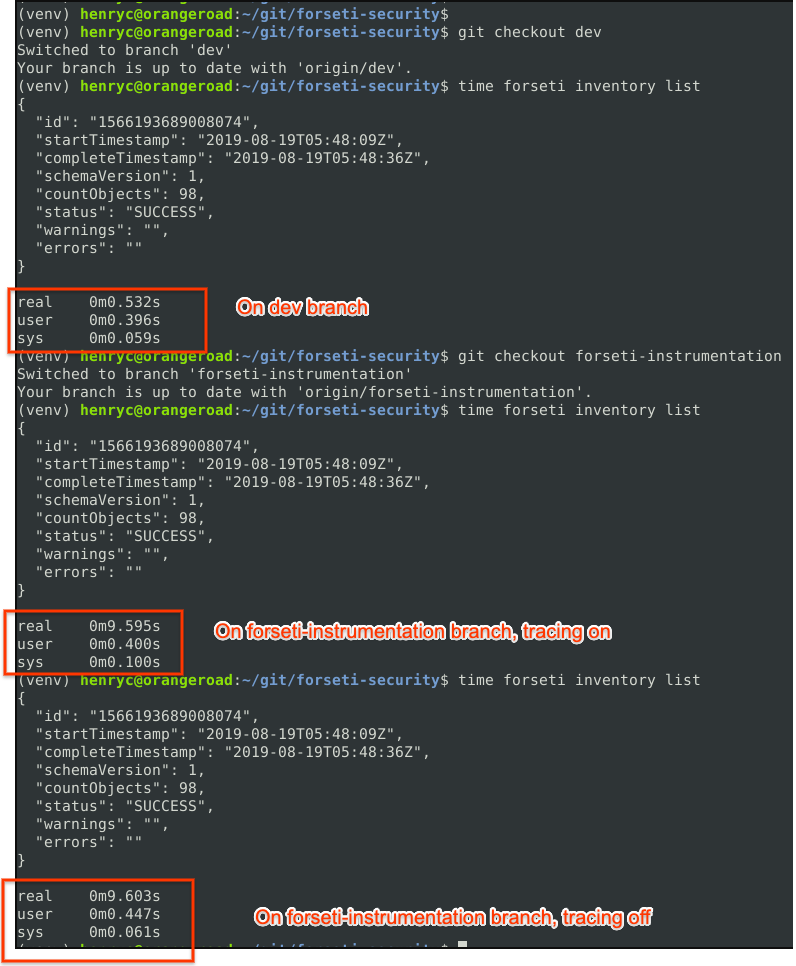
@blueandgold it's normal for the runtime to go up when tracing is enabled (tracing is disabled by default ). This time will only go up with addition of spans. There is an open issue on this census-instrumentation/opencensus-python#249. |
|
1: The latency is happening is even tracing is off on the server, please see the 3rd part of my screenshot, and my comment that this is possibly happening in the CLI side of the code 2: Are you saying that only one trace id is available each time that the server boots up? This seems counter-intuitive. My understanding is that each call to the server would generate it's own trace, so that we can detect variations of the calls. Can you show me documentation of what is the correct behavior here, or is this how it's implemented? |
|
@blueandgold regarding latency, I'm not seeing ~10 seconds lag. Screenshot below
|
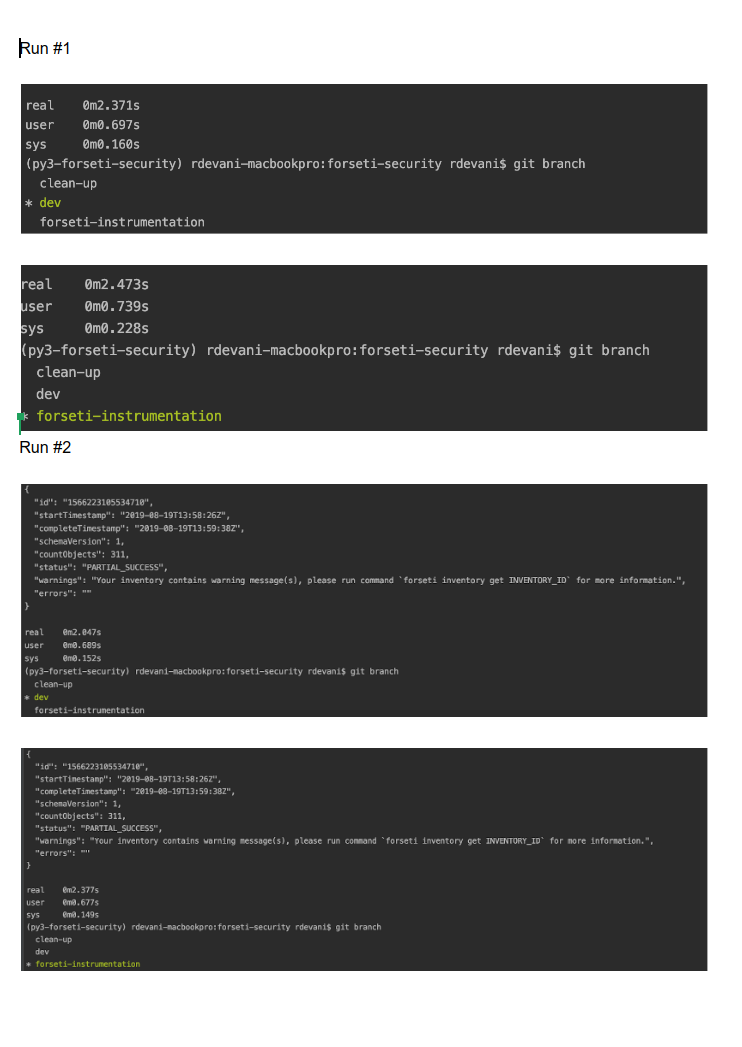
|
@blueandgold |
|
Cool, the latency has been verified by @kevensen to not be an issue, so it must be something in my environment. @red2k18 For #2, I am reporting that multiple |

|
@c24t might be able to answer 2/ better than me, as he has more knowledge of how OC works |

| return outer_wrapper | ||
|
|
||
|
|
||
| def trace(): |
There was a problem hiding this comment.
@c24t could you please review this decorator's code ? Trying to find something in there that would explain why trace_id for successive run is the same and does not seem to be reset. Thanks :)
note: this decorator could be added to OpenCensus code to get an easier way to trace multi-threaded functions - it automatically passes the tracer across separate contexts and provides an helpful way to pass it explicitely if needed.


|
Thanks for all the hard work here, but Cloud Profiler will meet our instrumentation needs, instead of Stackdriver Trace. |
7 participants


This PR implements below functionalities as part of instrumentation on Forseti using OpenCensus:
services thereby figuring out long-running methods to optimize.