


Abstract
Our heliosphere—the bubble in the local interstellar medium produced by the Sun’s outflowing solar wind—has finally responded to a large increase in solar wind output and pressure in the second half of 2014. NASA’s Interstellar Boundary Explorer (IBEX) mission remotely monitors the outer heliosphere by observing energetic neutral atoms (ENAs) returning from the heliosheath, the region between the termination shock and heliopause. IBEX observed a significant enhancement in higher energy ENAs starting in late 2016. While IBEX observations over the previous decade reflected a general reduction of ENA intensities, indicative of a deflating heliosphere, new observations show that the large (∼50%), persistent increase in the solar wind dynamic pressure has modified the heliosheath, producing enhanced ENA emissions. The combination of these new observations with simulation results indicate that this pressure is re-expanding our heliosphere, with the termination shock and heliopause already driven outward in the locations closest to the Sun. The timing between the IBEX observations, a large transient pressure enhancement seen by Voyager 2, and the simulations indicates that the pressure increase propagated through the heliosheath, reflected off the heliopause, and the enhanced density of the solar wind filled the heliosheath behind it before generating significantly enhanced ENA emissions. The coming years should see significant changes in anomalous cosmic rays, galactic cosmic radiation, and the filtration of interstellar neutral atoms into the inner heliosphere.
1. Introduction
The Sun’s atmosphere continuously escapes into space as a supersonically expanding solar wind. This solar wind excludes the ionized gas, or plasma, from the very local interstellar medium (VLISM), inflating a “bubble” called the heliosphere that surrounds the orbits of the planets and shields us from the vast majority of galactic cosmic radiation. The Voyager 1 and 2 spacecraft crossed the innermost interstellar boundary—the termination shock—at 94 au in 2004 (Stone et al. 2005) and 84 au in 2007 (Richardson et al. 2008; Stone et al. 2008), respectively. Voyager 1 crossed the heliopause in 2012 and left the heliosphere, passing into the VLISM at 121 au (Gurnett et al. 2013). Beginning in late 2008, the Interstellar Boundary Explorer (IBEX; McComas et al. 2009a) has been remotely imaging the global heliospheric interaction with the VLISM, using energetic neutral atoms (ENAs) propagating inward from these boundary regions (McComas et al. 2009b, 2012, 2014a, 2017; Schwadron et al. 2009; Fuselier et al. 2009; Funsten et al. 2009b). ENAs are produced in the heliosheath, the region between the termination shock and heliopause, by charge exchange between cold neutral atoms that come from the VLISM and the solar wind and incorporated pickup ions. These ions are heated as they pass through the termination shock so that some fraction of them produce ENAs that are moving back toward Earth and are detected by IBEX. ENA images are produced by the line-of-sight integrated emissions from each viewing direction (e.g., pixel).
The solar wind dynamic pressure, PDyn, which is proportional to its density multiplied by the square of its velocity, was generally decreasing from 2005 to 2010 (McComas et al. 2013) and then roughly constant from 2011 through the first half of 2014. In the second half of 2014, however, PDyn rose ∼50% from ∼1.6 to ∼2.4 nPa, where it has for the most part remained. McComas et al. (2017, p. 26) pointed out that this increase should have a major impact on the structure of the outer heliosphere: “At least toward the nose and direction of maximum heliosheath pressure ∼20° southward (McComas & Schwadron 2014), we predict that this dramatic increase in solar wind dynamic pressure will soon be reflected in IBEX data as enhanced ENA emissions from these regions—most likely in the 2017–2018 time frame—with changes from the Ribbon and flanks/near tail following by a couple years.” In this study we provide the first observations of the heliosphere’s response to this pressure enhancement.
2. Observations and Analysis
Figure 1 compares annual sky maps of ENA fluxes in IBEX’s highest energy channel (Funsten et al. 2009a) with the time history of PDyn observed at 1 au. The IBEX maps are Compton-Getting (CG) corrected, such that they are transformed from the spacecraft frame to the solar inertial frame (McComas et al. 2017). As IBEX orbits the Earth, the spacecraft spins about a nearly Sun-pointed axis, measuring ENA fluxes in latitudinal swaths (see McComas et al. 2009a for more details). Every 4–5 days, IBEX is repointed in longitude (McComas et al. 2011), shifting to the next swath to collect ENAs. Over the first six months of each year, IBEX observes the upwind hemisphere of the heliosphere in these “ram” maps (pole-to-pole scan containing the spacecraft’s velocity vector including the Earth’s orbital motion), scanning across the center of each map from right to left, continuing to fill in the downwind hemisphere over the second half of the year.
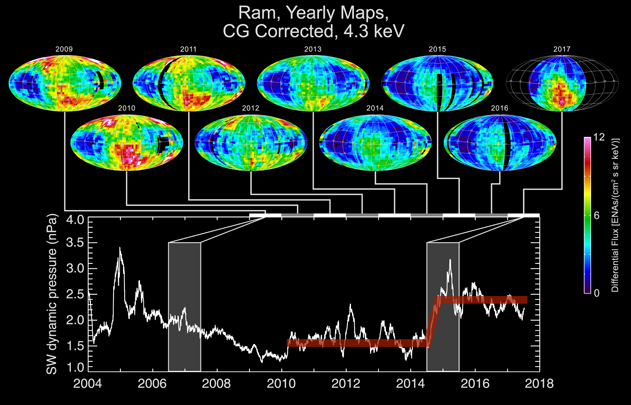
Figure 1. Outer heliosphere ENA emissions from 2009 to 2017 (top, Mollweide projections centered on the upwind direction, i.e., the direction of the inflowing interstellar gas), showing the delayed response to the solar wind dynamic pressure (smoothed over two Carrington rotations, bottom panel). The shaded regions indicate a typical delay of ∼2–3 years for solar wind changes at 1 au to be recycled in 4.3 keV ENAs.
Download figure:
Standard image High-resolution imageFigure 1 shows that, overall, the decreasing and then leveling off of the solar wind pressure is seen in the dimming of 4.3 keV ENAs but delayed a couple of years near the upwind direction. The large increase in solar wind pressure at 1 au in late 2014 is observed back at Earth in the first half of 2017 in the form of a strong increase in ENA fluxes from the region of the heliosheath closest to the Sun. Clearly, the enhanced solar wind pressure produced higher ion intensities in the inner heliosheath that led to more energetic ions charge exchanging into ENAs that were observed by IBEX.
The significant enhancement in ENAs in the 2017 map is limited to a region centered ∼30° south of the interstellar upwind direction. That direction is where the particle pressure in the inner heliosheath is greatest (Schwadron et al. 2014). This pressure enhancement is caused by the draping of the highly inclined interstellar magnetic field around the heliosphere. McComas & Schwadron (2014) argued that the draping explains the unexpected flow direction of the plasma in the inner heliosheath at Voyager 2 and indicates that the termination shock and heliopause are closest in this direction.
While we normally use IBEX ram data to analyze temporal trends due to the better statistics (McComas et al. 2014a, 2017), in this study we also include anti-ram data to improve the timing of when the enhancement in ENA fluxes began. Anti-ram data from the upwind hemisphere are collected in the second half of each year (opposite to ram directions). Figure 2 shows that the ENA fluxes observed by IBEX were indeed already elevated in late 2016. While it is not yet clear how much the ENA fluxes will continue to rise, this shows that the earliest observed return of ENAs affected by the increase in solar wind dynamic pressure is ∼2 years from the nearest parts of the heliosheath.
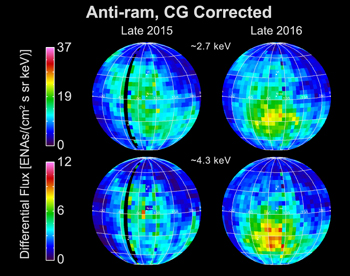
Figure 2. Comparison of ENA fluxes from late 2015 to late 2016 from CG corrected anti-ram data. We show data for the highest two energies, where a visible increase in ENA intensity is detected in late 2016.
Download figure:
Standard image High-resolution imageTo assist us in understanding how the heliosphere reacts to the change in solar wind dynamic pressure in late 2014, we compare IBEX observations to expectations from numerical simulations of the solar wind and VLISM interaction (Figure 3) using a 3D plasma-neutral code that solves magnetohydrodynamic (MHD) equations for the plasma and Boltzmann’s equation for neutral hydrogen, coupled via energy-dependent, charge-exchange source terms (Pogorelov et al. 2008). The interstellar medium boundary conditions use the magnetic field derived from the IBEX Ribbon and Voyager observations (Zirnstein et al. 2016), a corresponding temperature of 7500 K and flow speed of 25.4 km s−1 (McComas et al. 2015), and proton and neutral hydrogen densities of 0.07 and 0.13 cm−3, respectively.
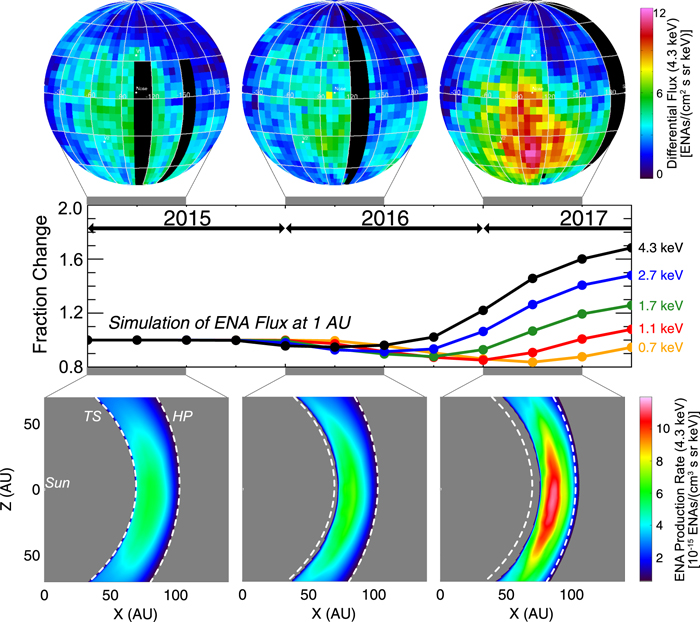
Figure 3. Comparison of the 4.3 keV ENA fluxes observed by IBEX in the first halves of 2015, 2016, and 2017 in the upwind hemisphere (top row) with simulation results for the various IBEX energy bands (middle, color coded, averaged over a 20° × 20° region centered on the simulated peak maximum) and the spatial distribution of simulated ENA production rates (bottom); these rates are time-lagged for propagation to Earth (∼6 months in the past at this energy) to match the IBEX maps. We show the surface of the simulation termination shock (TS) and heliopause (HP) in early 2015 in each of the bottom panels (white dashed lines) to show the change in their positions over time.
Download figure:
Standard image High-resolution imageThe MHD simulation solves the interaction between the solar wind and VLISM, producing a heliopause that separates the solar wind and VLISM plasma, and a termination shock beyond which the solar wind plasma is subsonic and is diverted down the heliotail. In reality, the presence of pickup ions in the solar wind generates a non-thermal component, and the core solar wind can appear to be supersonic in the heliosheath due to its low temperature (Richardson et al. 2008). In the MHD simulation, the code solves for the total pressure, which includes pickup ions produced by charge exchange with neutral hydrogen, such that the single-fluid plasma downstream of the termination shock is always subsonic.
In the simulation, we incorporate solar wind observations at 1 au by introducing a step function increase in solar wind dynamic pressure from 1.64 to 2.41 nPa in late 2014, and a time-dependent ENA solver (Zirnstein et al. 2017) to compute ENA fluxes at 1 au comparable to IBEX observations. We use 1 au solar wind data averaged over 2010–2014.5 (406.03 km s−1, 5.94 cm−3) and 2015–2017 (441.81 km s−1, 7.37 cm−3) for before and after the step function. Because the simulation does not include a separate population of alpha particles, we included their pressure by increasing the density of the protons such that the total dynamic pressure is equivalent to observed pressures of 1.64 and 2.41 nPa.
The simulations provide expectations for the delay and relative enhancement of the ENA fluxes for various ENA energies (middle panel of Figure 3). Comparison of IBEX ENA fluxes from early 2016 and 2017 shows enhancements that are greatest at the highest energies (Figure 4), qualitatively consistent with the simulations. However, enhancements in simulated fluxes begin later than and are not as strong as in the observations, and the location of greatest enhancement is not offset as far south of the upwind direction as observed by IBEX. Nevertheless, the simulation provides a useful qualitative comparison.
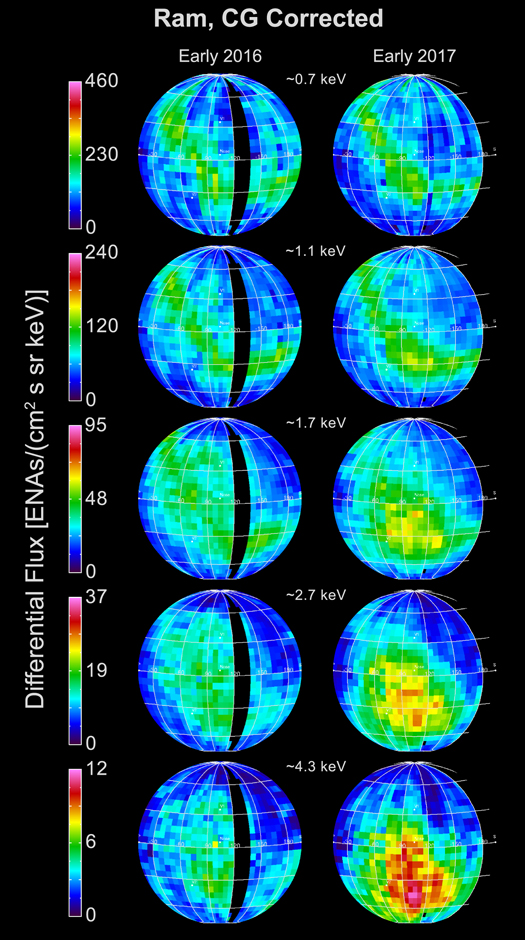


Figure 4. Comparison of ENA fluxes from early 2016 to early 2017 from CG corrected ram data. The IBEX Ribbon is visible in the lowest energies, 0.7 and 1.1 keV. At higher energies, the ENAs are progressively enhanced with increasing energy from the 1.7 to 2.7 to 4.3 keV energy bands, consistent with the greater generation and faster return of higher energy ENAs calculated by the numerical model (Figure 1).
Download figure:
Standard image High-resolution image
Because it takes almost a year for the solar wind to propagate to the upwind termination shock, and ∼6 months for 4.3 keV ENAs to propagate over a similar distance back toward Earth, the time it takes for the heliosheath plasma pressure to significantly increase is approximately 6 months. Consistent with these rough estimates, Voyager 2 observed its largest enhancement in heliosheath dynamic pressure in late 2015 (Richardson et al. 2017), which was most likely associated with the late 2014 pressure enhancement. However, ENAs observed by IBEX do not become enhanced until late 2016, ∼1 year after the Voyager 2 pressure enhancement.
The timing between the pressure increase at 1 au, observations at Voyager 2, and ENA observations from IBEX suggests a complicated story in the heliosheath. When the pressure increase in the supersonic solar wind reaches the termination shock, it launches a transient pressure pulse that moves relatively quickly through the heliosheath as observed by Voyager 2. The bulk motion of the plasma fills more slowly in the heliosheath behind this pulse. The enhanced ENA production did not occur until after the pressure pulse had propagated significantly beyond Voyager 2. This is corroborated by the simulation, which indicates that only after the pressure pulse propagates to the heliopause and reflects back into the heliosheath and a significant fraction of the heliosheath is filled with higher-density plasma from the solar wind do the overall heliosheath pressure and the line-of-sight integrated ENA emissions significantly increase.
The simulation also predicts that the ENA spectrum flattens after 2017. This is a direct result of a ∼10% increase in solar wind speed observed at 1 au in late 2014. While the increase in solar wind dynamic pressure (density times the square of speed) results in a higher thermal pressure in the heliosheath, the increase in solar wind speed increases the sonic Mach number ahead of the termination shock. After the initial outward motion of the termination shock, its motional speed diminishes, and the higher Mach number flow upstream creates a higher temperature plasma and flatter ENA spectrum emitted from the heliosheath. To demonstrate this correlation, we also simulated a scenario where the 50% increase in solar wind dynamic pressure was due to an increase in solar wind density only. That simulation did not significantly change the ENA spectral index at 1 au.
By 2017, the simulated structure of the outer heliosphere is substantially modified with the termination shock moving outward ∼7 au and heliopause moving outward by ∼2 au, with the heliopause moving an additional ∼2 au in the following year. Similar motions of the termination shock and heliopause were found by earlier models. For example, Izmodenov et al. (2005) also simulated a factor ∼1.5 increase in solar wind dynamic pressure, yielding outward motions up to ∼7 and ∼4 au for the termination shock and heliopause, respectively. While the heliosheath becomes thinner, the ENA emissions increase, indicating the line-of-sight integrated ion intensities are significantly higher. The combination of IBEX data and simulation suggest that our heliosphere is returning to a size comparable to that a decade ago.
Another interesting aspect of the energy-dependent fluxes shown in Figure 4 is that the IBEX Ribbon, seen at the two lowest energies, appears largely unchanged from 2016 to 2017. The simulation presented here generates only “globally distributed flux” from the inner heliosheath, between the termination shock and heliopause. Numerous potential sources of the Ribbon have been proposed since its discovery in 2009 (McComas et al. 2009b, 2014b) and some type of secondary ENA source beyond the heliopause (McComas et al. 2009b; Chalov et al. 2010; Heerikhuisen et al. 2010; Schwadron & McComas 2013; Isenberg 2014; Giacalone & Jokipii 2015) has emerged as the leading candidate for producing the Ribbon (McComas et al. 2017). If this is correct, the next year or two should show significant enhancement in the Ribbon ENA fluxes and provide important new information about the distance to the source region, the charge exchange rate, and other properties of the nearby interstellar medium, just beyond the heliopause.
3. Broad Implications
A large-scale reconfiguration of the global structure and properties of the heliosphere has implications for changes in the production of anomalous cosmic rays (Potgieter 2010), the modulation of galactic cosmic rays (Scherer et al. 2002; Ferreira et al. 2008), the filtration of interstellar neutral atoms (Schwadron et al. 2013), and the production of secondary neutral populations (Kubiak et al. 2016). Time-dependent changes like these have occurred in the past and will likely occur again in the future as the heliosphere moves through more dense or rarefied regions of the interstellar medium (Florinski et al. 2003), and the output of the Sun modulates significantly with time (Rahmanifard et al. 2017). Thus, the observations reported here connect the study of the time-dependent heliosphere with direct observations using ENAs.
Data used in this study have been validated using procedures developed by the IBEX team (McComas et al. 2012, 2014a, 2017), and are available to the community. This work was funded by the IBEX mission as a part of the NASA Explorer Program (NNG17FC93C; NNX17AB04G). We acknowledge solar wind ram pressure data at 1 au from missions such as ACE and Wind, collected in the OMNI database: ftp://spdf.gsfc.nasa.gov/pub/data/omni.